
15 Best Qualitative Data Analysis Software of 2024
These qualitative data analysis tools are a quick and easy way to manage and analyze your qualitative data! From qualitative software (QDA software), qualitative data analysis tools (QDA tools), text analyzer tools, and text mining tools to other software that helps you organize your observation notes and unlock insights, you will find the tool for you down below!
What is the best qualitative data analysis software?
The best qualitative data analysis software is one that meets your specific needs and has the necessary features to effectively manage and analyze your data. So think of what you need: a research repository, software to help you analyze the data, a tool to help you with research notetaking? Or all of this in one software?
Here are the key features to look for in your search for your digital QDA assistant: advanced search and retrieval tools, in-depth visualization options, and collaborative team features. Additionally, the software should be user-friendly and integrate well with other tools you are using.
It is also important to consider the pricing, whether it is a perpetual license or subscription-based, and what level of support is available.
Below we list the best options the market has to offer.
Atlas.ti: Best AI Qualitative Data Analysis Software
Overview
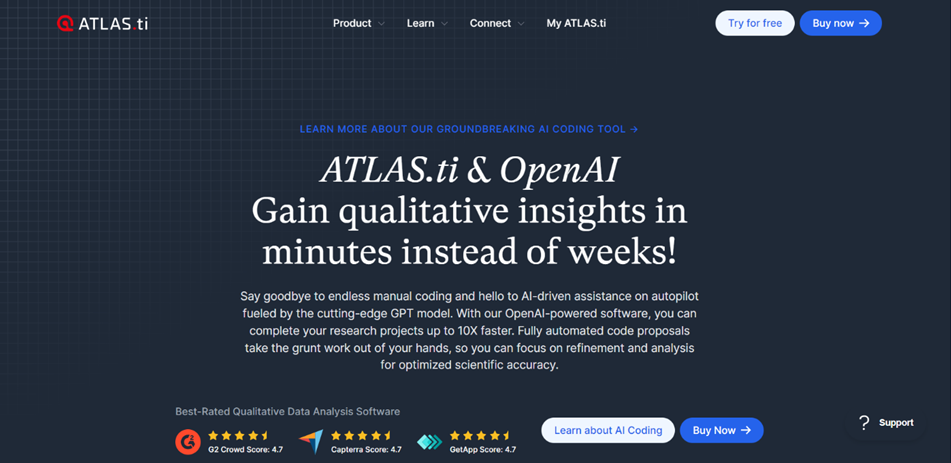
Atlas.ti is a qualitative data analysis software that uses AI and machine learning algorithms to speed up the research process by generating deep insights in minutes instead of weeks (which saves you so much time). Atlas.ti is designed to remove the headaches from qualitative data analysis by automating the heavy lifting, including importing and organizing files, refining and analyzing data, and visualizing and sharing insights.
Atlas.ti’s top features include AI coding, team collaboration in real-time, Open AI-powered tools, license management redefined, full compatibility with Windows, Mac, and Web, and free live support 24/5.
Highlights
- Atlas.ti allows users to import data from various sources (text documents, PDF files, HTML files, images, audio data, video data, social media data, and survey files).
- Users can tag qualitative insights using codes and collaborate with team members for faster outcomes.
- Atlas.ti supports survey data analysis, interview analysis, focus group analysis, literature review and analysis, content analysis, UX research, homework, bachelor & master thesis, doctoral dissertations, term papers, and more.
- With AI coding, the software automatically generates code proposals, eliminating manual coding, and allowing users to focus on refinement and analysis for optimized scientific accuracy.
- Team collaboration is easy, and users can invite team members to collaborate efficiently on projects in real time.
- OpenAI-powered tools enable users to reduce overall data analysis time by more than 90% (which helps with time management almost like one of the best AI time management tools).
Pricing

- Free trial version
Atlas.ti offers Educational licenses, Commercial licenses, Non-commercial licenses, and many more. Some of them are listed below:
- Personalized Single-User Web Plan for $55 per month
- Multi-User Licence for PC, Mac, and Web Plan for $579 per user annually
- Multi-User Licence for PC, Mac, and Web for 5 Users Plan for $1,900 annually
- Multi-User Licence for PC, Mac, and Web for 10 Users Plan for $3,440 annually
Bottom line
Atlas.ti is best used for both qualitative text analysis and market research, and anyone can use it to generate deep insights automatically, leveraging the latest AI and machine learning algorithms for faster results. Overall, Atlas.ti is a highly recommended qualitative data analysis software (as shown by their ratings), and a great one flat fee solution, with no hidden costs or surprises.
Dovetail: Best Data Analysis Tool for Integration
Overview
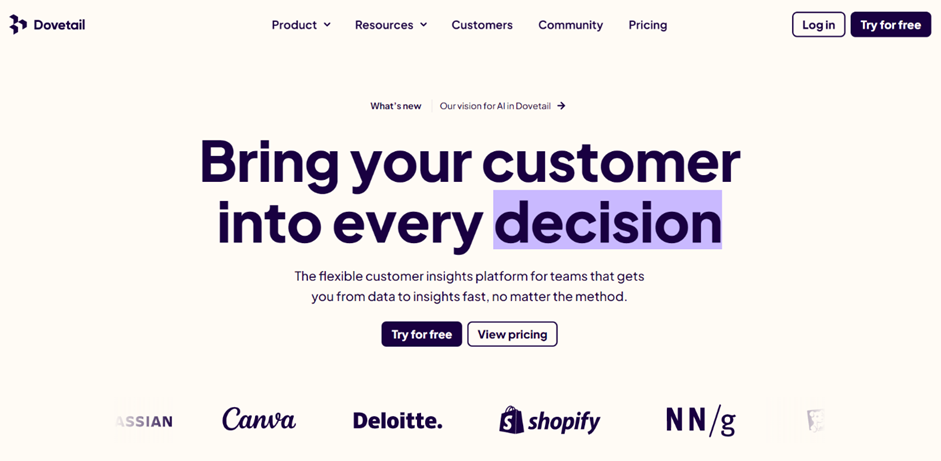
Dovetail is a flexible customer insights platform that provides a comprehensive solution for teams to collect, store, analyze, and share customer feedback and insights from various sources, including user interviews (customer interviews), survey responses, product feedback, competitor analysis, and more.
Highlights
- Dovetail’s standout features include integrations with popular tools like Slack, Atlassian, Notion, and Zapier.
- The platform also offers customization options that allow users to add their organization’s branding and flair to their insights hub.
- The system is designed with industry-standard security, reliability, and privacy controls to ensure that the data is secure and available when users need it.
- Dovetail offers metrics on insights and files to give users a better understanding of who’s reading their work, including aggregate data like the audience, engagement ratio, and more.
- With over 100 templates available, users can quickly get started with projects that are specifically designed to uncover insights into various kinds of customer data.
Pricing
Dovetail offers a free trial before committing to a paid plan.
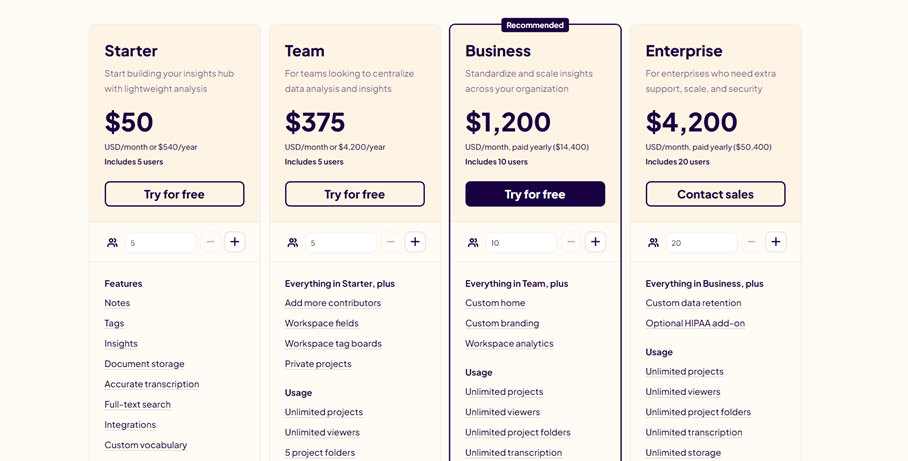
- Starter Plan for $50 per month includes 5 users
- Team Plan for $375 per month includes 5 users
- Business Plan for $1200 per month includes 10 users
- Enterprise Plan for $4200 per month includes 20 users
Bottom line
Dovetail is best suited for teams (including product managers, designers, marketers, user researchers, customer support teams, and more) that want to build their company’s insights hub and scale knowledge across their organization with customization, integrations, security, privacy, and compliance features.
With Dovetail, teams can bring their customer into every decision they make, putting the customer first in everything they do.
Airtable: Best Tool For Creating a Research Repository
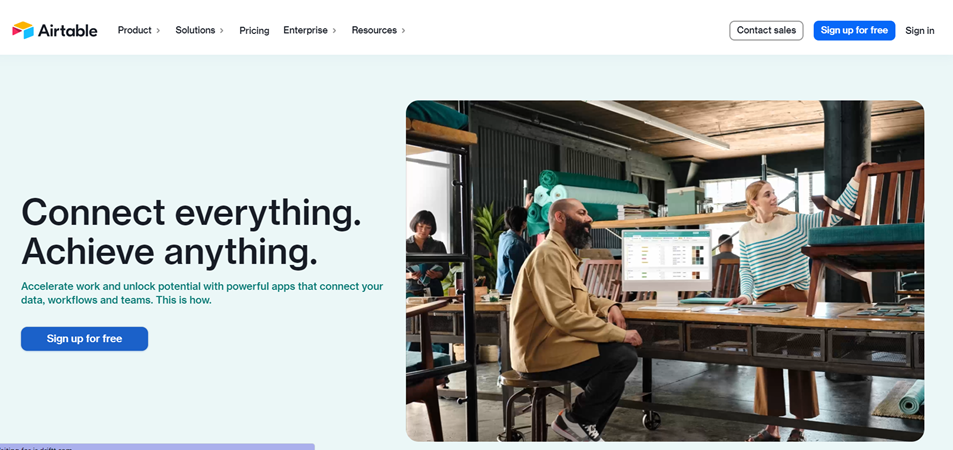
Overview
Airtable is a highly adaptable software that enables users to reimagine their workflows through Interface Designer, which allows for the creation of custom interfaces without code.
Highlights
- Interface Designer offers various views, including List, Timeline, Kanban, Gantt, Calendar, and Grid View, to manage work better and execute faster.
- With its intuitive design and pre-made templates, users can quickly start building solutions that match their team’s agility and scale. With drag-and-drop components, anyone can create a completely custom interface in minutes.
- The software’s deep integrations, advanced extensibility, and expert support make it an excellent choice for teams of all industries looking to reach new heights.
- To use Airtable for research notetaking, the user can create a form with different fields that correspond to the research protocol. The form can include fields for participant ID, the notetaker’s name, the name of the task or feature, the script text, and questions related to the research. Airtable allows the user to track whether the user was successful in completing a task, rate tasks, and add miscellaneous notes.
- Airtable is a great resource if you want to create a portfolio-level research repository, and we’ve provided you with a step-by-step guide.
Pricing
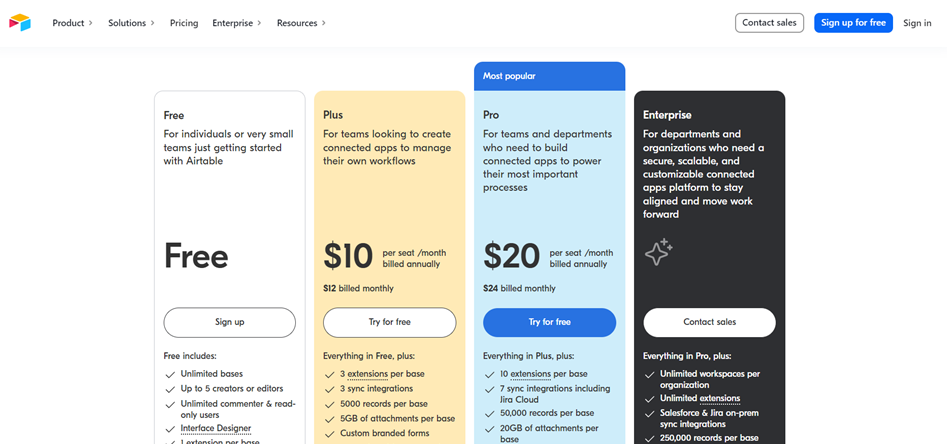
- Free Plan
- Plus Plan is $12 per month per seat
- Pro Plan is $24 per month per seat
- Enterprise Plan is custom-tailored
Bottom line
Airtable is best used for consolidating data sources, analyzing data from multiple sources simultaneously, creating a research repository, and automating processes to streamline the research team workflows.
MonkeyLearn: Best No-Code Text Analytics
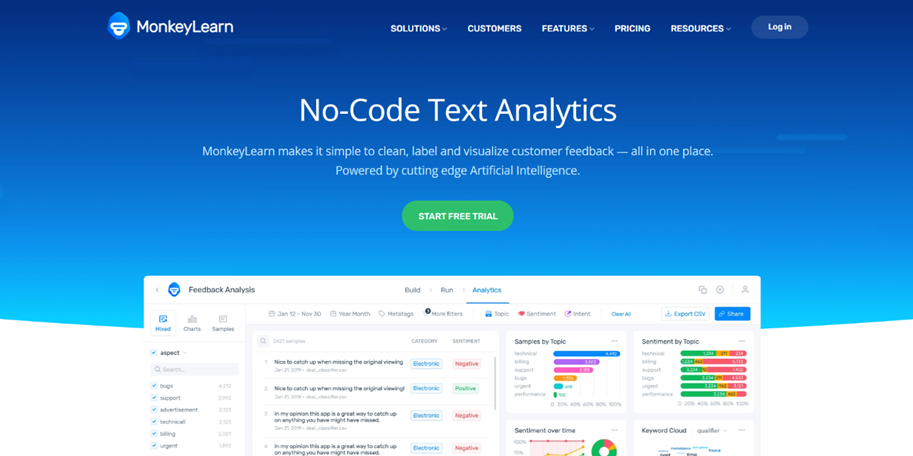
Overview
MonkeyLearn is a powerful no-code text analytics tool that allows users to clean, label, and visualize customer feedback data all in one place. It is a popular software tool for data-driven companies who want to dive deeper into the data. The software is powered by cutting-edge artificial intelligence.
Highlights
- The tool offers instant data visualization and detailed insights for users to gain a better understanding of their data, including the ability to create custom charts and visualizations.
- One of the standout features of MonkeyLearn is its pre-built and custom machine learning models that users can use to build topic classifiers, sentiment analysis, entity extractors, and more.
- The tool also offers business templates that are tailored for different business scenarios and are equipped with pre-made text analysis models and dashboards.
- Users can choose from a range of templates to best match their data type and the problem they want to solve.
- MonkeyLearn has several use cases, including NPS analysis, review analysis, CSAT analysis, support analysis, survey analysis, and VoC analysis.
Pricing
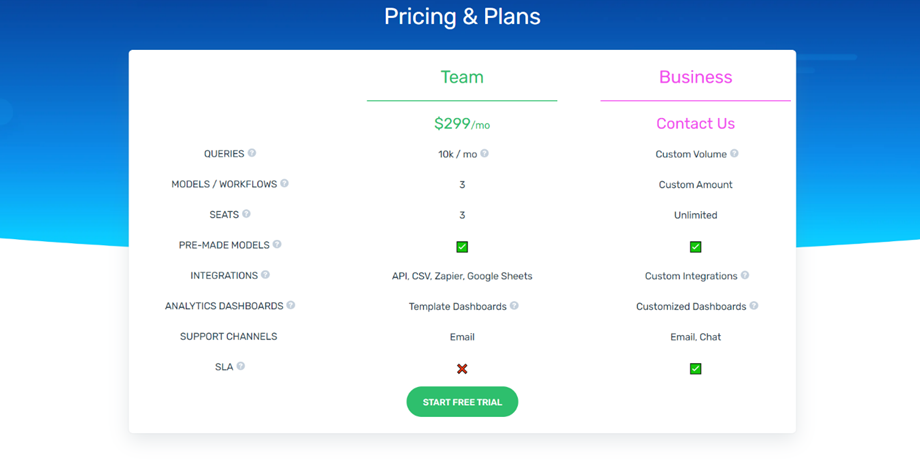
- Free trial before committing to a paid plan
- Team Plan for $299 per month
- Business Plan is custom-tailored
Bottom line
MonkeyLearn is the best qualitative data analysis software for data-driven companies that want to simplify their text analytics with a user-friendly interface.
MonkeyLearn is a great tool for users who want to gain deeper insights into their customer feedback data and drive business improvements and customer satisfaction.
EnjoyHQ: Best For Centralizing Research
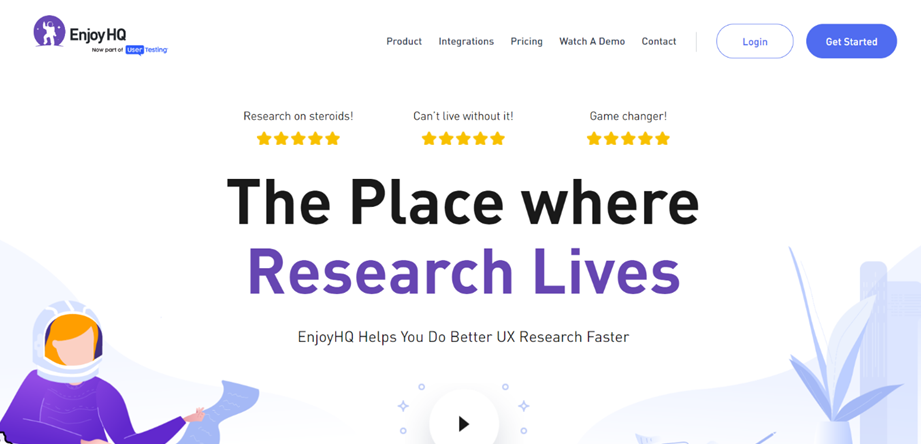
Overview
EnjoyHQ is a qualitative data analysis software tool that centralizes research data, streamlines research processes, improves collaboration, and makes sharing insights easier. The tool helps researchers build an effective research system and improve their efficiency in collecting and organizing data.
EnjoyHQ is a GDPR-compliant software tool that is trusted by private and public companies worldwide for data security and privacy compliance.
Highlights
- One of the standout features of EnjoyHQ is its tag and property manager which keeps the classification system organized. Researchers can manage tags, properties, and labels easily.
- Another feature is the advanced search function, which uses AI-powered search to find anything in seconds, with hundreds of filters at the user’s fingertips.
- EnjoyHQ allows users to standardize their research practice by building templates that everyone can use, empowering more people to conduct better research.
- The tool’s native integrations offer deep integrations that give users real superpowers and access to customer feedback easily, which simplifies workflows and helps users avoid complicated workflows.
- With unlimited storage and unlimited transcriptions, users can upload files of all sizes and formats with no additional charges and turn audio or video recordings into timestamped transcripts.
- The software tool also offers 24/7 stellar support to help users migrate data from other platforms or get set up from scratch.
Pricing
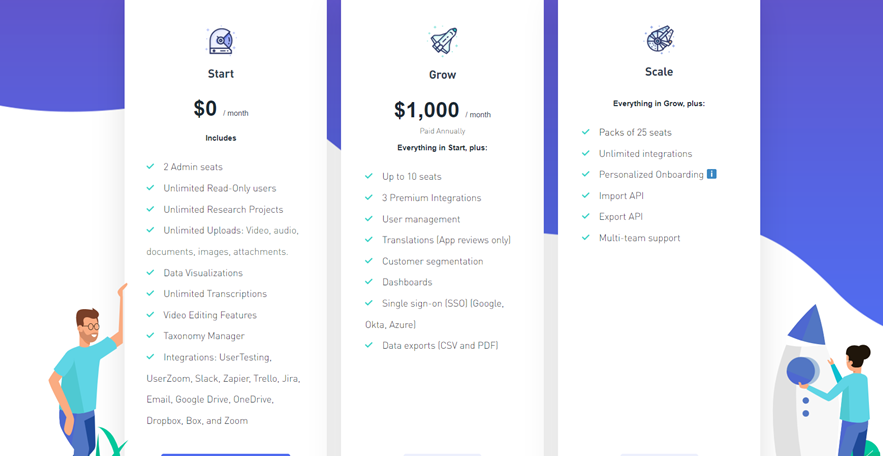
- Free Starter Plan
- Grow Plan for $1000 per month includes up to 10 seats
- Scale Plan is custom-tailored
Bottom line
EnjoyHQ is designed to help teams and individuals move from old and unproductive practices to supercharge their ResearchOps. The tool is best used to centralize all research data, improve collaboration, standardize research processes, and share insights easily.
Aurelius: Best Way to Communicate Findings
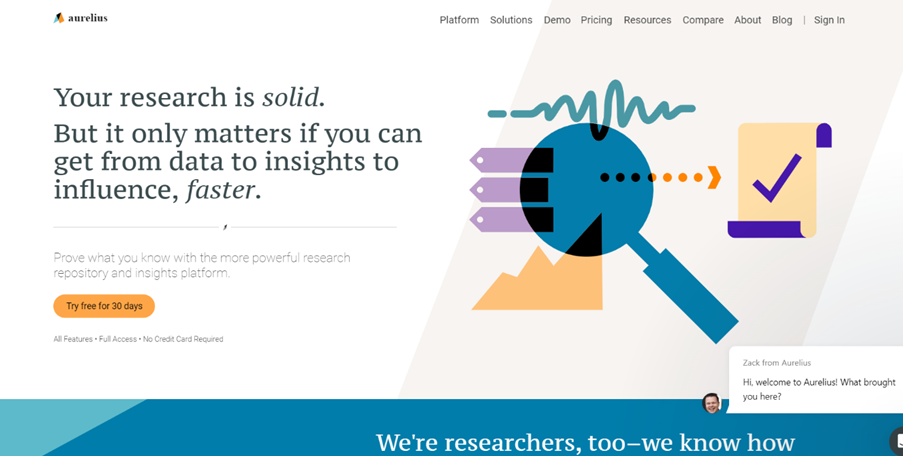
Overview
Aurelius is a research and insights platform that offers a simple, lightweight, and flexible way to handle qualitative research data. The tool is designed to streamline the research process from data synthesis to key insights and recommendations, making it easier to communicate findings.
The platform is flexible enough to accommodate a range of research projects, from usability tests to expert interviews to field research.
Highlights
- The platform allows users to quickly import hundreds of notes in seconds and find key insights with ease.
- Researchers can create groups or themes to analyze later and use collections to the group and organize key insights and recommendations from across multiple projects.
- Users can also search across multiple studies and projects, import Zoom recordings and transcribe any audio from interviews and research sessions, and send key insights and recommendations from research to the place where development teams work through Jira integration.
- Aurelius offers an analysis board for UX research synthesis and creating affinity diagrams, keyword searches, and bulk tags.
- Users can slice and dice research data by tags, keywords, and sentiment to figure out what they have learned and quickly synthesize a higher volume of data than ever before.
- The platform also allows users to create insights, capture recommendations, and share reports.
- The platform is lightweight, flexible, and designed to streamline the research process.
Pricing
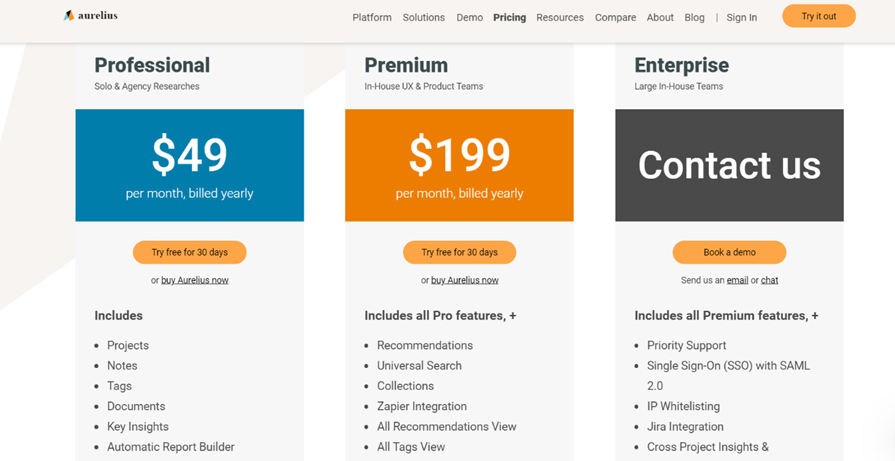
- Free 30-day trial before committing to a paid plan
- Professional Plan for $49 per month
- Premium Plan for $199 per month
- Enterprise Plan is custom-tailored
Bottom line
Researchers often struggle with a lack of proper tools that are built for research purposes, and they end up patching together spreadsheets, collaboration tools, and list apps that are not efficient. The Aurelius software is intended for research teams that need a platform to document and store research data securely for years and make it easy to access.
Condens: Best for UX Research Analysis
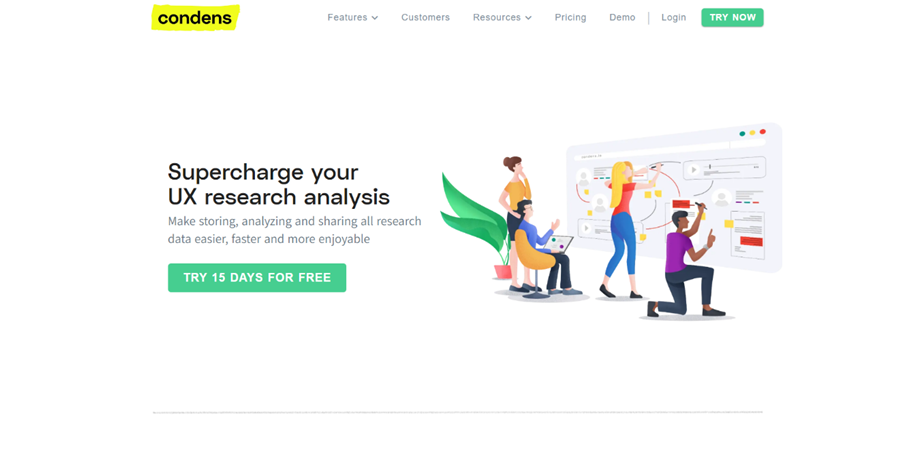
Overview
Condens is a software tool designed specifically for analyzing UX research data. It is a user research repository that simplifies the process of storing, analyzing, and sharing research data with your team (almost like one of the best research repository tools).
With Condens, you can structure your data and connect evidence to see patterns more clearly, keeping everything in view with a visual way of working. The tool is intuitive and designed for collaboration, making it easy for colleagues to participate in research by working jointly on projects simultaneously and seeing changes in real time.
Highlights
- One of the top features of Condens is its automatic transcription for video and audio, which is fully timestamped and enabled with clips and highlight reels.
- It provides a unique synthesis process, making it easy to process qualitative data as you go.
- Condens is designed specifically for analyzing UX research data, and it brings structure to the chaos of qualitative research data, simplifying time-consuming tasks while maintaining a flexible workflow.
- Condens provides AI-assisted tagging, which enables you to structure data by attaching tags to notes and files, and it has a flexible tag management system that allows for powerful yet easy-to-use segmentation.
- With Condens, you can share research findings with the click of a button without losing control over what you share and what should remain confidential.
- It provides a dedicated interface for clients and colleagues to access research findings.
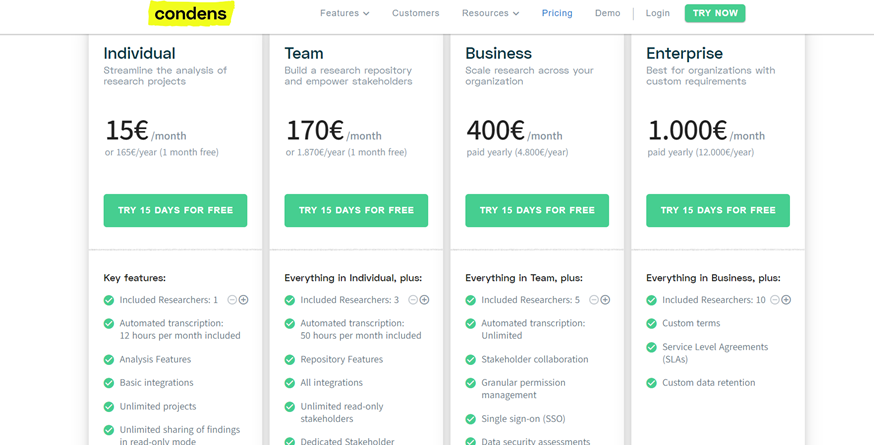
- Free 15-day trial before committing to a paid plan
- Individual Plan for $15 per month
- Team Plan for $170 per month
- Business Plan for $400 per month
- Enterprise Plan for $1000 per month
Bottom line
Condens helps researchers stay GDPR compliant and treat sensitive data responsibly, ensuring that sensitive data remains secure. The tool is ideal for UX researchers and designers, product managers, customer insights professionals, and market researchers who need to store, structure, and analyze user research data (just like some of the best user research tools).
MaxQDA: Best Qualitative and Mixed-Methods Data Analysis Software
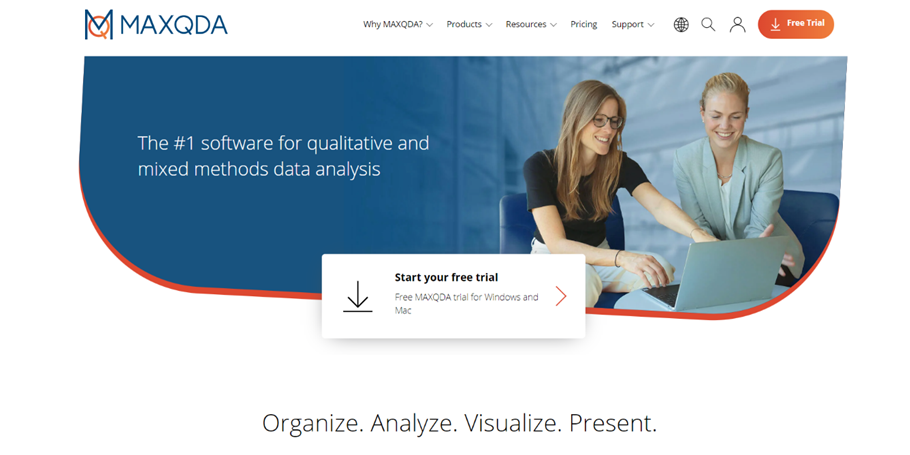
Overview
MaxQDA is a software designed for qualitative and mixed-methods data analysis. The software is equipped with features that allow users to organize, analyze, visualize, and present their research results.
With MaxQDA, users can analyze and transcribe interviews, analyze literature and textual data, manage their entire research project, and analyze questionnaires. The software also has an unbeatable variety of mixed-methods functions, making it possible to include quantitative analysis methods in qualitative data analysis.
Highlights
- MaxQDA’s interface is intuitive and easy to learn, and users can quickly find their way around with the help of numerous tutorials, guides, webinars, and an active community.
- The software also allows for efficient teamwork, and the new TeamCloud feature takes care of file management and team communication.
- Comprehensive customer support is available to users through phone, email, chat, and helpful FAQs and practical online manuals.
- MaxQDA is an identical software for both Windows and macOS.
- The software was developed by researchers for researchers, and users can take it from worldwide stakeholders in free-form letter and survey format to inform the standard setting process.
Pricing
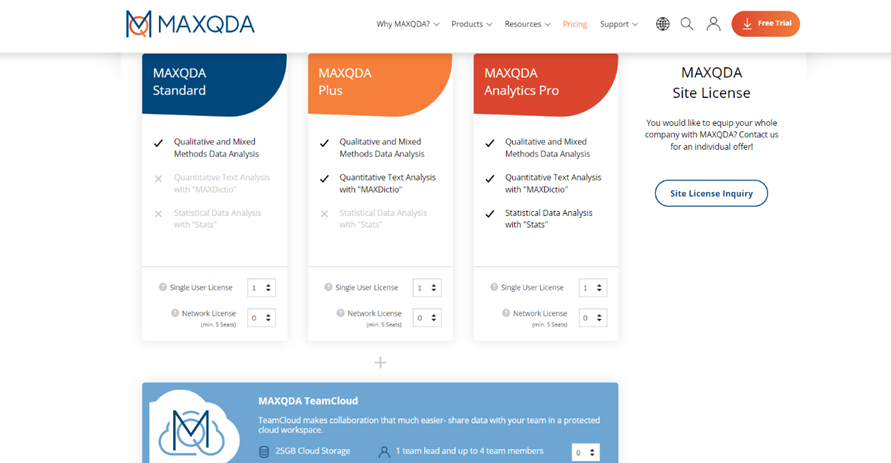
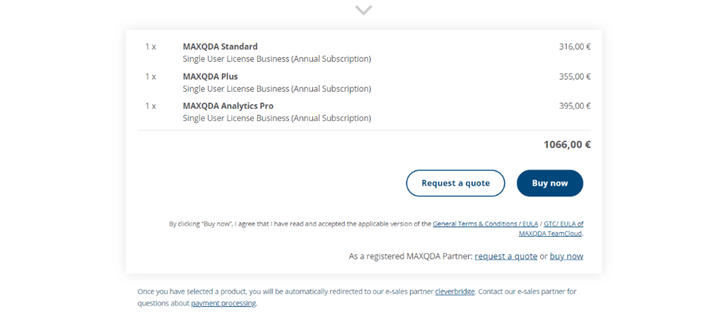
- Free trial before committing to a paid plan
- MAXQDA Standard Licence is $316 per year
- MAXQDA Plus Licence is $355 per year
- MAXQDA Analytics Pro Licemce is $395 per year
Bottom line
MaxQDA is intended for researchers and analysts who work with qualitative and mixed-methods data. The software is best used for analyzing interviews, transcribing and coding interviews, analyzing literature, managing research projects, analyzing questionnaires, and performing mixed-methods analysis.
Delve: Best Tool for Coding Qualitative Data
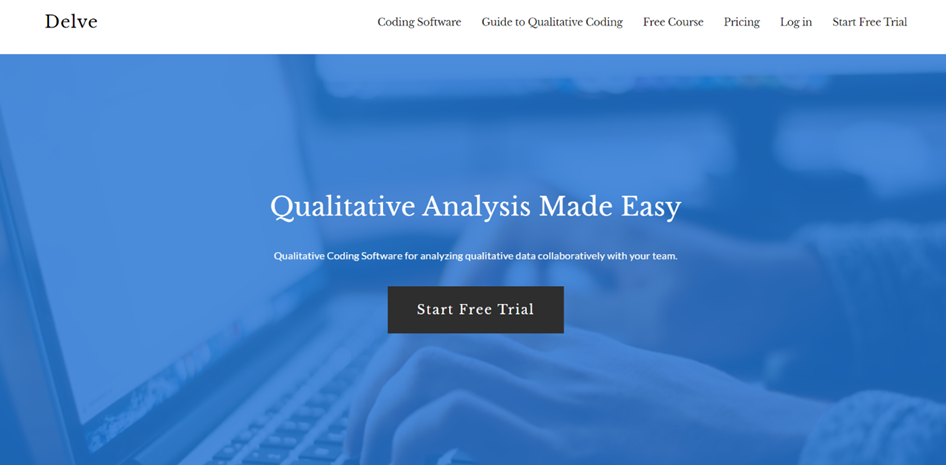
Overview
Delve is a collaborative online qualitative data analysis software that simplifies the process of finding rigorous, human insights. The tool can be used to analyze qualitative data from various methodologies such as grounded theory analysis, thematic analysis, narrative analysis, and more.
The software supports various methods of qualitative data collection, including semi-structured interviews, in-depth interviews, focus groups, customer interviews, survey responses, observations, ethnographies, diary studies, and case studies. Delve’s online course covers topics such as types of qualitative data, how to transcribe an interview, and an introduction to coding qualitative data.
Highlights
- Delve’s flexible coding system is iterative and evolving, allowing researchers to find, group, and refine themes efficiently.
- The interface is intuitive and easy to use, streamlining the research analysis process.
- Delve also allows researchers to categorize their quotes by code, pattern, demographic information, and more.
- One of Delve’s standout features is its ability to show researchers how representative their insights are, ensuring that insights accurately represent all participants.
- Delve also puts every important quote at researchers’ fingertips, allowing them to trace all their findings back to the raw data using backlinks.
- Delve has received positive reviews from researchers who have used the platform for qualitative dissertations and qualitative research, and who appreciate the tool’s simplicity and ability to streamline the coding process.
Pricing
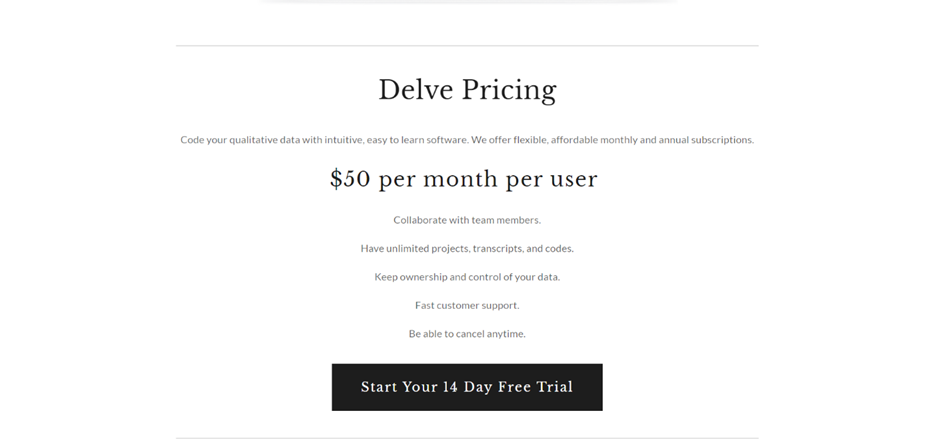
- Experience Delve with their 14-day free trial
- Pricing starts at $50 per user per month
- Educational, Institutional, and Enterprise pricing are available upon request
Bottom line
Delve is intended for researchers who want to stay organized and analyze qualitative data efficiently when completing their dissertations or other research.
Overall, Delve is a powerful qualitative analysis tool that empowers researchers to find insights that are more representative and less biased, helping them create powerful findings that enable client decision-making.
Optimal Workshop: Best Free Research Platform
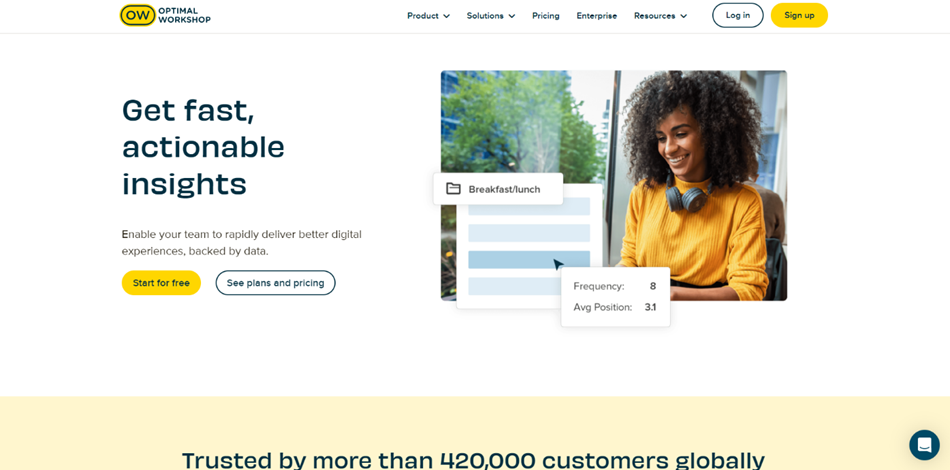
Overview
Optimal Workshop is a powerful research platform with five specialized research tools in one place. It is trusted by more than 420,000 customers globally, including companies such as Uber, IBM, Capital One, GE, and Yelp. The platform offers several testing methods to support the research workflow, including specialized tools for card sorting, tree testing, first-click testing, surveys, and user interviews, all in one platform (just like one of the best user testing tools).
Highlights
- OptimalSort, one of the top features of the platform, allows users to discover how people conceptualize, group, and label ideas. With OptimalSort, users can confidently optimize their content structure.
- Treejack, another standout feature of the platform, provides useful insights to build a site structure that works for the people using it.
- Chalkmark, a first-click testing tool, allows users to test design prototypes with users quickly and easily for faster iterations, feedback, and turnaround.
- Questions, an online survey tool, helps users understand their customers, find the right people for their studies, and learn from their results.
- Reframer, a qualitative research tool, enables users to capture all their research notes, usability tests, and observations collaboratively in one place. Then, they can make sense of their findings quickly with easy-to-use analysis tools.
- The Optimal Workshop platform streamlines research, provides actionable insights, and saves valuable time with automated analysis.
- The platform offers flexible, automated, and detailed analysis options, with granular visualizations available to analyze data the way users prefer and communicate findings with clarity.
- With instant, in-app access to their panel of over 239 million participants, users can find and recruit high-quality participants easily. For highly targeted participants, they can use Optimal Workshop’s custom recruitment service.
Pricing
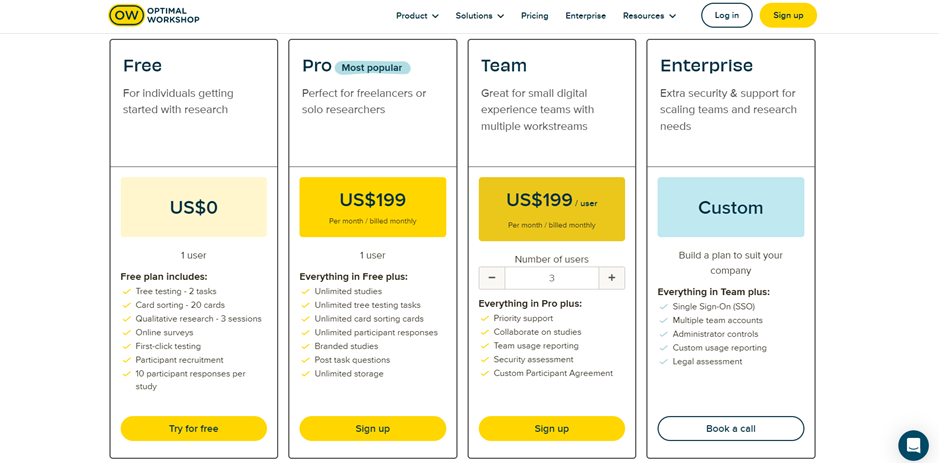
- Free Plan
- Pro Plan for $199 per month is the most popular pricing plan
- Team Plan for $199 per user per month
- Enterprise Plan is custom-tailored
Bottom line
The software is intended for researchers, designers, and marketers who want to deliver efficient, customer-focused solutions.
Overall, Optimal Workshop is a great tool for those looking for a comprehensive research platform with multiple testing methods, superior analysis tools, and easy participant recruitment.
NVivo: Best Platform for Collaboration
Overview
NVivo is a leading qualitative data analysis software solution that helps users uncover actionable insights from their qualitative and mixed methods research data. This collaborative platform allows users to ask complex questions about their data, employ advanced data management and visualization tools to uncover richer insights, and produce clearly articulated, defensible findings backed by rigorous evidence.
With NVivo 14, users can work more efficiently, conduct deeper analysis from more sources, get accurate insights, collaborate with fellow researchers in real time, and defend their findings with the most cited qualitative data analytics software.
Highlights
- NVivo 14 allows users to import text files, audio files, videos, emails, images, spreadsheets, online surveys, web content, and social media from various sources into a simple, intuitive interface.
- The software centralizes data from multiple sources to conduct the most in-depth analysis possible.
- Team members can code simultaneously, with all contributions appearing in real-time, making research collaboration easier.
- The software provides powerful insight-generating tools to help researchers accelerate insight and achieve the strongest analysis of the data.
- Users can ask complex questions to discover meaning in their data and quickly visualize it with word frequency charts, word clouds, comparison diagrams, and more.
- NVivo 14 also offers direct integration to data from Citavi and enables researchers to import notes and data directly from Microsoft Excel and Word, and even integrate with SurveyMonkey.
- The transcription add-on allows researchers to skip the time-consuming transcription process with automated transcriptions that offer 90% accuracy from quality audio and video formats (just like one of the best transcription tools).
- A native editor helps users quickly make changes, tag speakers, and ensure proper formatting all while hearing the synchronized audio.
Pricing
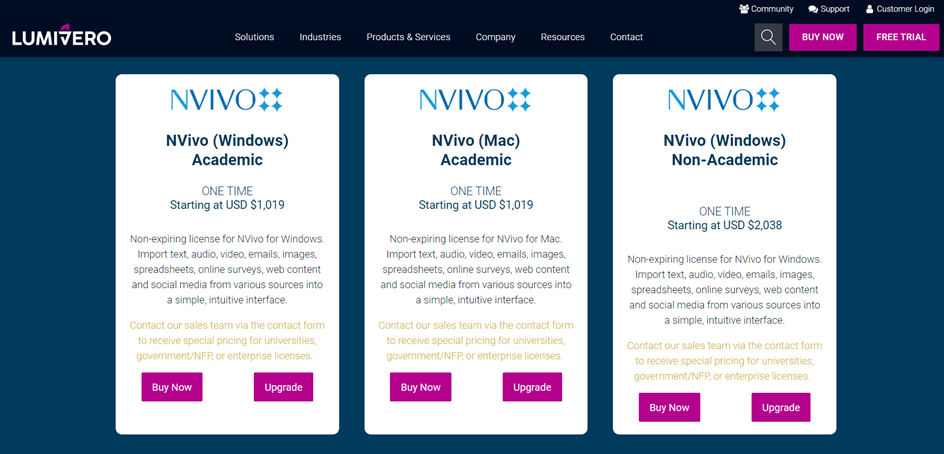
NVivo offers different pricing plans as well as a free trial version:
- NVivo (Windows) Academic: One-time payment starting at $1,019
- NVivo (Mac) Academic: One-time payment starting at $1,019
- NVivo (Windows) Non-Academic: One-time payment starting at $2,038
- NVivo (Mac) Non-Academic: One-time payment starting at $2,038
Bottom line
NVivo 14 is best suited for researchers who want to find patterns and connections in documents, transcriptions, and surveys in addition to other qualitative mediums like video, audio, and images – unstructured data that is difficult (if not impossible) to analyze without a tool like NVivo 14.
Coda: Best Software for Textual Data
Overview
Coda is a powerful software tool that enables teams to bring together their words, data, and teamwork into a single doc. Unlike niche workflow tools, Coda comes with a set of powerful building blocks, so teams can create the tools they need.
It is used by over 80% of the Fortune 100, including big names like The New York Times, BuzzFeed, and Uber.
Highlights
- One of Coda’s standout features is its ability to customize and evolve with your team. As teams grow or plans change, you can use Coda’s building blocks to seamlessly evolve your doc.
- Connected data allows tables to talk to each other, and edits show up everywhere, so you can roll up your team’s plan to an executive dashboard and sync updates automatically.
- Coda also connects to thousands of apps, allowing you to embed, synchronize, and take action on the tools you use every day – all from your doc.
- Another key feature of Coda is its Gallery, which is full of pressure-tested playbooks published by some of the most innovative thinkers and makers out there.
- From workflow basics to inventive collaboration tools, the Coda Gallery has pre-baked templates you can drop right into your doc, helping you to get started quickly.
- Coda is a leader in 10 software categories, including product management solutions, but its flexibility as an all-in-one doc means it can do much more.
Pricing
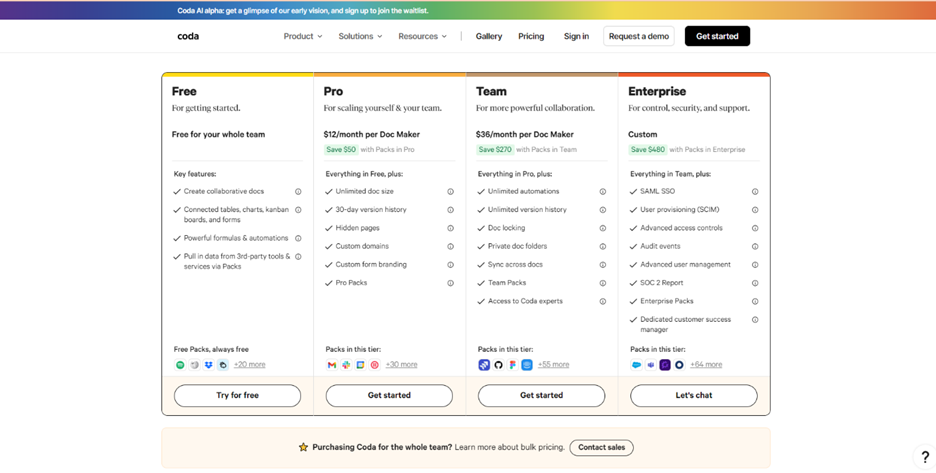
- Free Plan to get you started
- Pro Plan is $12 per month and the first of paid plans
- Team Plan is $26 per month
- Enterprise Plan is custom-tailored
Bottom line
Coda is intended for product, design, and engineering leaders at organizations of all sizes. It is best used as a single source of truth for reducing ambiguity and centralizing meeting notes, product vision, hard decisions, and more.
Notion: Best Tool for Observation Notes and Centralizing Knowlege
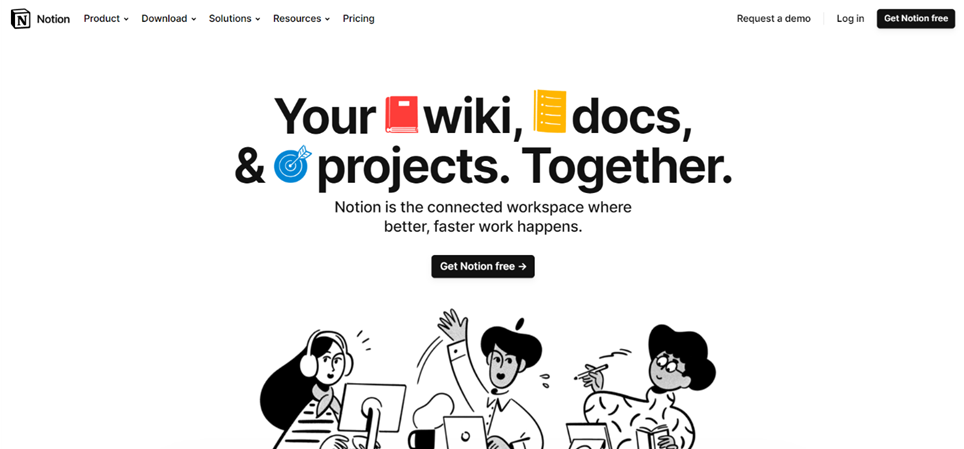
Overview
Notion is a connected workspace designed to centralize knowledge, documentation, and project management. Millions of users, including next-generation startups and established enterprises, use Notion every day.
The tool aims to consolidate tools, cut costs and provide better, faster work. Notion is customizable, as users can drag and drop anything, from images to embedded databases, to track and organize tasks better.
Highlights
- One of the top features of Notion is its powerful building blocks, allowing users to visualize, filter, and sort tasks and projects in various ways, such as through a board, table, timeline, gallery, or list.
- Notion provides flexibility, allowing users to create their labels, tags, and owners, enabling everyone to have context, stay organized, and break down projects in the most helpful way.
- Notion has a vibrant community that produces content, teaches courses, and leads events globally, making it an always-on support network.
- Notion is the wiki that redefines the wiki. Its sidebar keeps the workspace organized, while the powerful filters let anyone find data and decisions across teams in seconds.
- Synced Blocks feature allows users to edit content once and apply the changes everywhere else, without wondering about the latest version.
- Notion AI is their latest addition, enabling you to summarize a text in seconds, write that email with no stress, make text longer, or shorter, and change the tone of the text or even the language!
Pricing
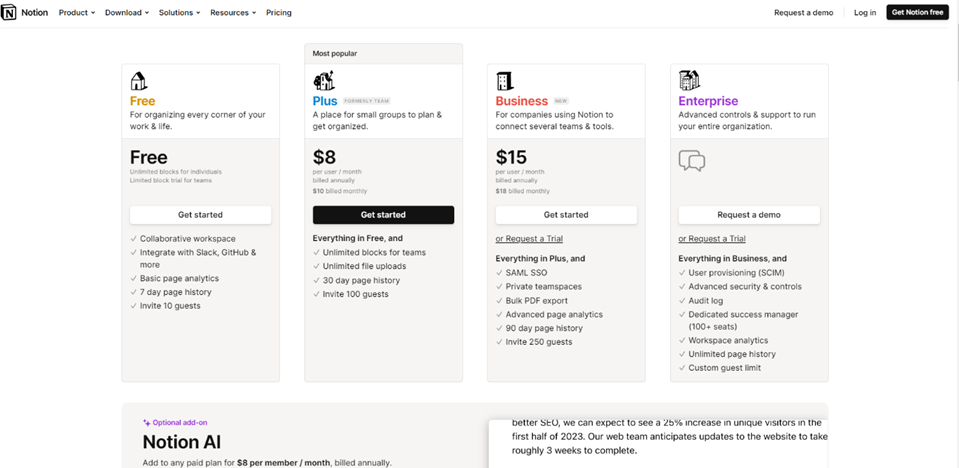
- Free Plan
- Plus Plan is $8 per month
- Business Plan is $15 per month
- Enterprise Plan is custom-tailored
Bottom line
Notion is designed for those who want to centralize their knowledge, manage projects, and create efficient documentation, as well as for those who seek customization and flexibility. Notion is best used for consolidating tools and cutting costs, centralizing knowledge, documentation, and project management, and improving work efficiency.
Excel: Best Spreadsheet Software
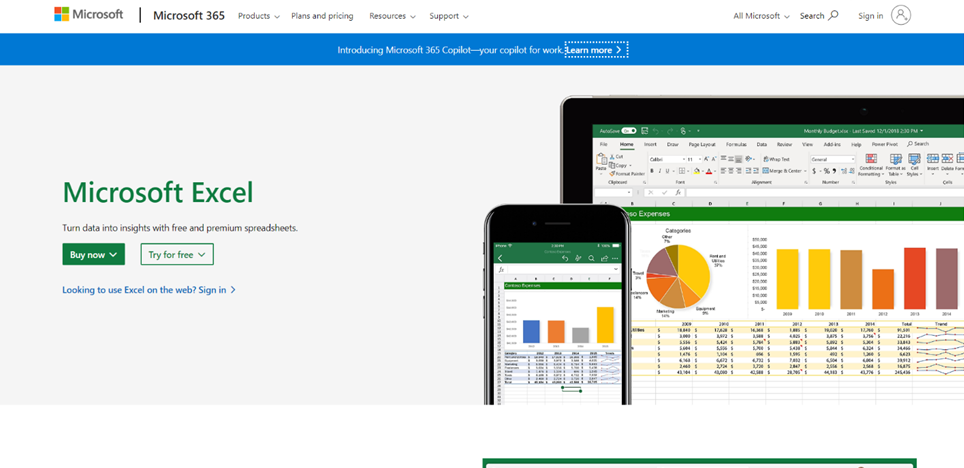
Overview
Microsoft Excel is a versatile and widely used spreadsheet software that helps turn data into insights for both businesses and home users. Excel provides free and premium spreadsheets, with intelligence-enhanced tools for experts and beginners.
Highlights
- Users can easily create spreadsheets from templates or create their own with modern formulas for calculations.
- Excel provides tools to visualize data in compelling ways with new charts and graphs, formatting, sparklines, and tables to predict trends.
- The software allows real-time collaboration with others from mobile, desktop, or online apps, with commonly used features and real-time co-authoring capabilities in the browser.
- Excel is available on a range of devices including Apple, Android, Windows, and Amazon.
- One of the standout new features of Excel is the Copilot, which helps identify trends, suggest what-if scenarios and build an easy-to-read dashboard. Copilot in Excel makes it easier to analyze and explore data, which streamlines business decisions.
- Excel provides templates for over 40 categories, making it easier to jumpstart spreadsheets and add professionalism.
- The software’s camera click feature allows users to make analog spreadsheets digital, where they can take a picture of a printed data table and automatically convert it into a fully editable table in Excel.
- Excel connects to trusted Power BI data sources, and users can discover Power BI tables through the data types gallery, providing real-time access to live, trusted data.
Pricing
Excel is included in Microsoft Packages.
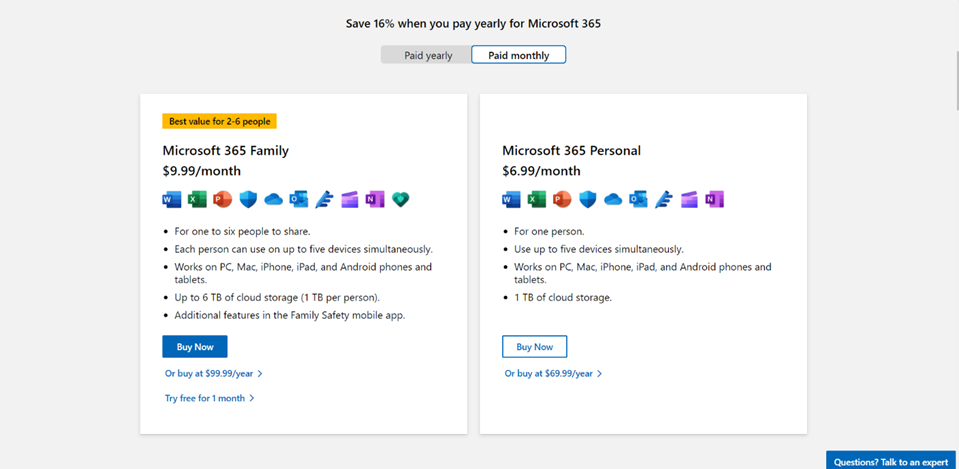
- Microsoft 365 Familly Plan is $9.99 per month
- Microsoft 365 Personal Plan is $6.99 per month
Bottom line
Microsoft Excel is best suited for businesses and home users who need to analyze and manage data and create budgets, financial statements, schedules, and project plans.
Google Sheets: Best Online Spreadsheet Tool
Overview
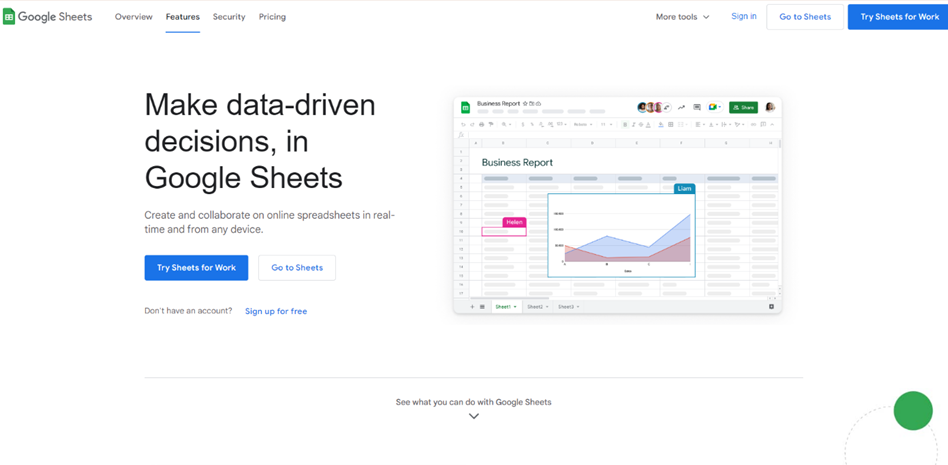
Google Sheets is a powerful and collaborative tool that allows users to create and analyze online spreadsheets in real-time, from any device. With its easy sharing and real-time editing features, users can establish a ground truth for data and keep analysis flowing by using comments and assigning action items.
Highlights
- One of the top features of Google Sheets is its built-in intelligence, which includes assistive features like Smart Fill and formula suggestions. Additionally, users can get insights quickly by asking questions about their data in simple language.
- Google Sheets is also seamlessly connected to other Google apps, such as Google Forms, Google Slides, Google Docs, and Gmail. Users can analyze Google Forms data in Sheets or embed Sheets charts in Google Slides and Docs. They can also reply to comments directly from Gmail and present their spreadsheets to Google Meet.
- Another great feature is that users can easily edit Microsoft Excel spreadsheets online without converting them, and layer on Sheets’ enhanced collaborative and assistive features like comments, action items, and Smart Fill. Users can also speed up workflows by building business apps and automation with AppSheet, without writing any code.
- Finally, Sheets is secure by default, using industry-leading security measures to keep users’ data safe. All files uploaded to Google Drive or created in Sheets are encrypted in transit and at rest, and compliance controls are regularly verified. Sheets also adheres to the same robust privacy commitments and data protections as the rest of Google Cloud’s enterprise services.
Pricing
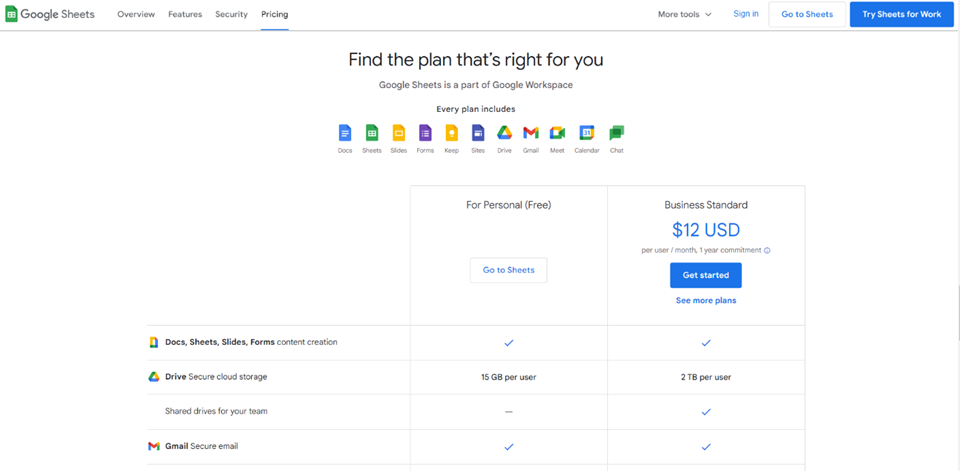
- Free Plan for personal use
- Business Standard Plan for $12 per month per user
Bottom line
Google Sheets is intended for individuals, teams, and businesses who need to make data-driven, informed decisions together. It is best used for data analysis, tracking, budgeting, project management, and collaboration.
What is qualitative data analysis software?
Qualitative data analysis software is a powerful tool that allows researchers to fully explore and understand non-numerical data. The software works by organizing and managing large amounts of non-numerical data, such as text, images, and audio.
The qualitative analysis software will provide you with a variety of tools for exploring and analyzing data, including advanced search and retrieval features, visualization options, and collaborative team features. QDA software is used to manage, organize, and analyze a wide variety of data formats, including text, images, and audio.
How can I analyze my qualitative data?
One way is to use operating systems that are specifically designed for qualitative analysis. This software can help you to quickly and easily sort through your data, identify key themes and patterns, identify themes, and make sense of your findings.
However, if you prefer to take a more hands-on approach, you can also manually code and categorize your data. This can be a very time-consuming process, which is why we compiled this list to help you save both time and resources.
Can SPSS be used for qualitative data?
While SPSS is primarily used for quantitative data analysis, it does have some features for analyzing qualitative data. However, we recommend using other software specifically designed for qualitative analysis for more accurate and efficient results. One such software is ATLAS.ti, which allows for in-depth insights from text data, graphical, audio, and video data.
Final thoughts
Finding the right qualitative data analysis software can be a game-changer for managing and analyzing your data. It can save you so much time, reduce errors, and provide insights that might otherwise be missed.