
How to create research repository at a portfolio level
How I’ve leveraged Airtable to create centralized user insights for my team
Without a research repository, no one can find your research later.
You do all this work to run a research study. It takes at least two weeks, sometimes a month or more.
Then what? You create a report of some sort and present it.
Now you’ve got ALL this data that lives all over the place. It might live in documents in your file management system, which all have their own privacy settings and are really hard to navigate.
Imagine if it’s all in one place.
That’s where a research repository comes in.
Regardless of study type, you can keep track of the studies that have been done, but it’s possible not all of what I’m about to talk about will work for other methods. As a note, for the most part, we run usability, concept, and prototype testing, so that’s where I’m coming from in how I’ve structured much of the research repository. That said, I’ve also stored data for tree tests and benchmarking studies in the repository.
In this article, I’m going to focus on the way that I’ve implemented a research repository using Airtable at my team’s portfolio level. I’ve also used Airtable to take structured research notes.
My pre-research repository struggles
I was [am] constantly asked about past user testing research findings and various questions about my studies. I’d have to go back into the files and find it so I could send them the link. Now, when I get asked, I send them to my repository.
There are three main use cases for sharing a research repository with your team:
- seeing an overview of what research has been done already
- managing the research pipeline
- absorbing observations and insights from research sessions.
Overview of past and planned research
Everyone I work with can access the research repository and go into it to see what research has already happened and what we’re planning to do. There is a tab for all study information and then there’s a tab just for research questions.
Let me see all the studies!
If I had a FAQ page for myself, the number one question would be “have you done a study on this?”
I haven’t quite eliminated this step, but the more people find out about the repository, the less I’m being asked that.
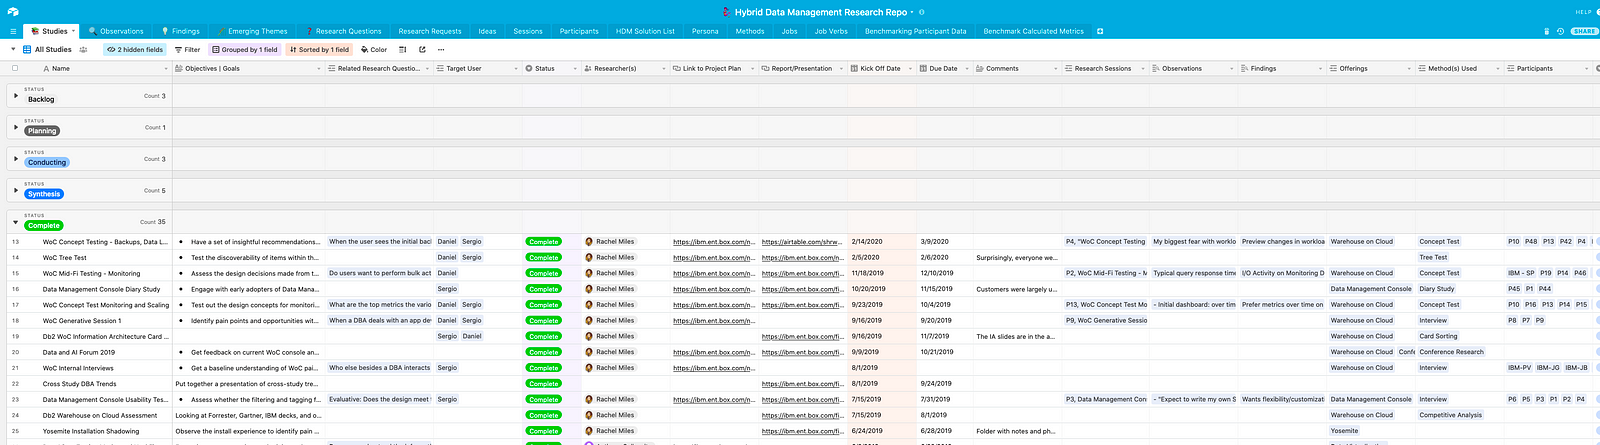
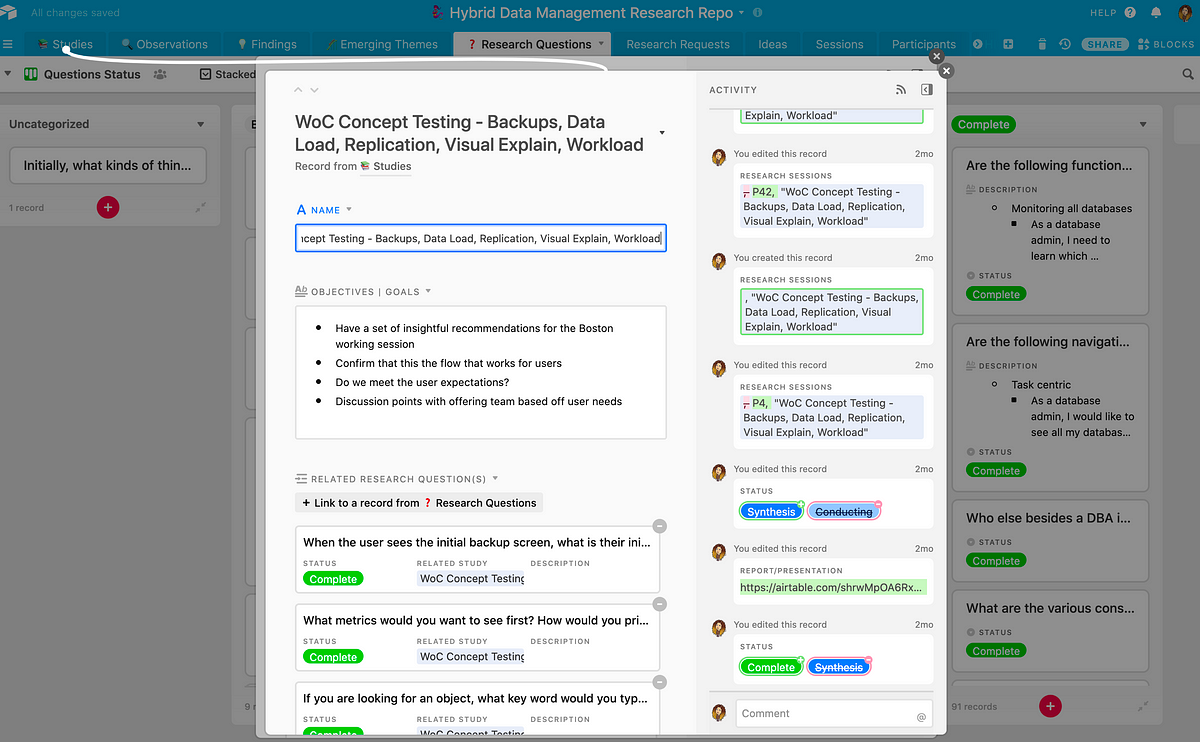
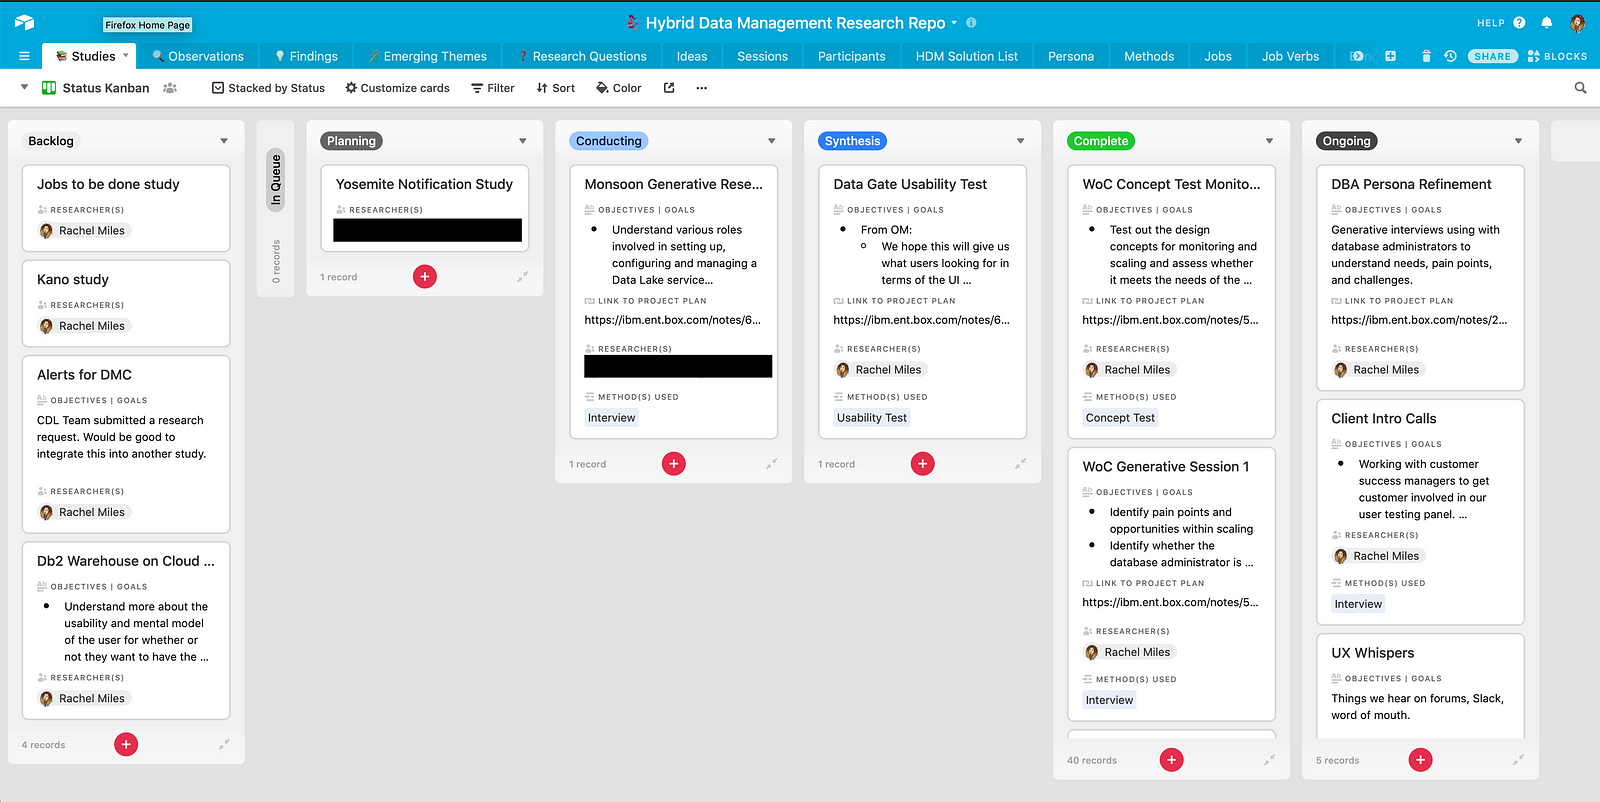
The launching point of the repository is the “Studies” tab. It has pretty much everything you need to know about a research study:
- product name
- research method used
- objectives and goals
- research questions
- target user/persona
- study status
- project plan
- final report
- session notes and findings
- participants from the study
It’s a one-stop shop for everything you need to know. I take advantage of Airtable’s linked records to create connections between the data in the fields. For instance, if someone clicks on “Research Method,” they can see a description of that method, what studies have been conducted using that method, and the actual research sessions associated with that method.
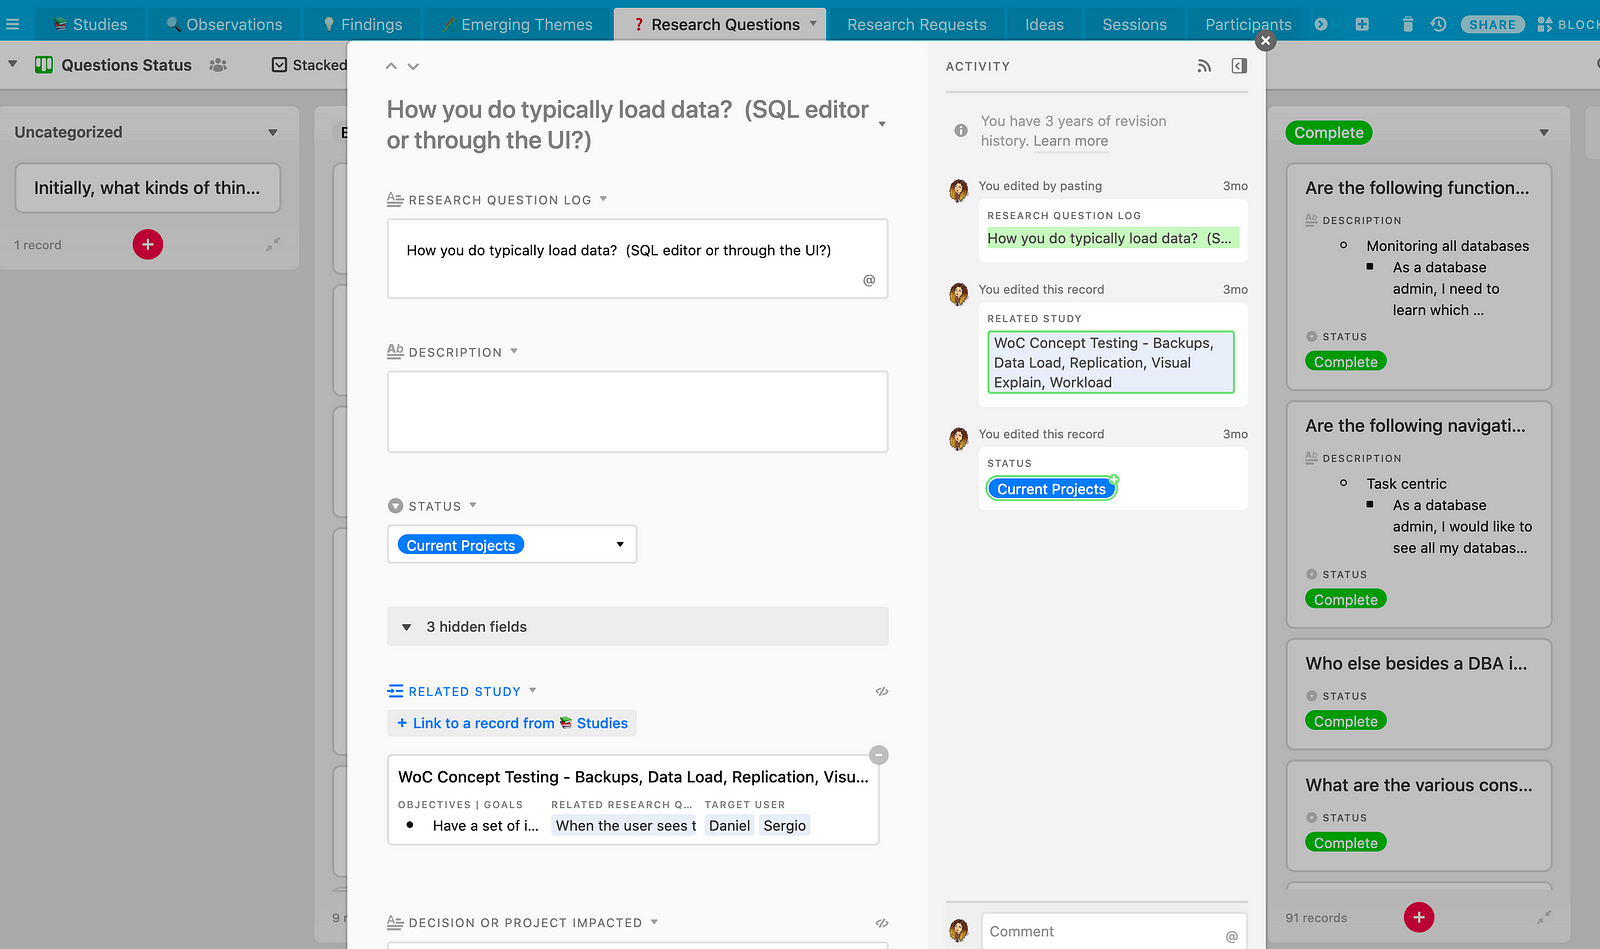
Why should I care about looking at all the research questions?
In a domain like the one where I work, there’s a lot of overlap in the questions we tend to ask for a study. A lot of times, my teammates ask the same questions over and over.
Having a collection of research questions in one place provides more transparency and rigor to the questions we address in research studies.
While we can view all the research questions in a spreadsheet format, we can also view them in a kanban style board, which is more visual and interactive.
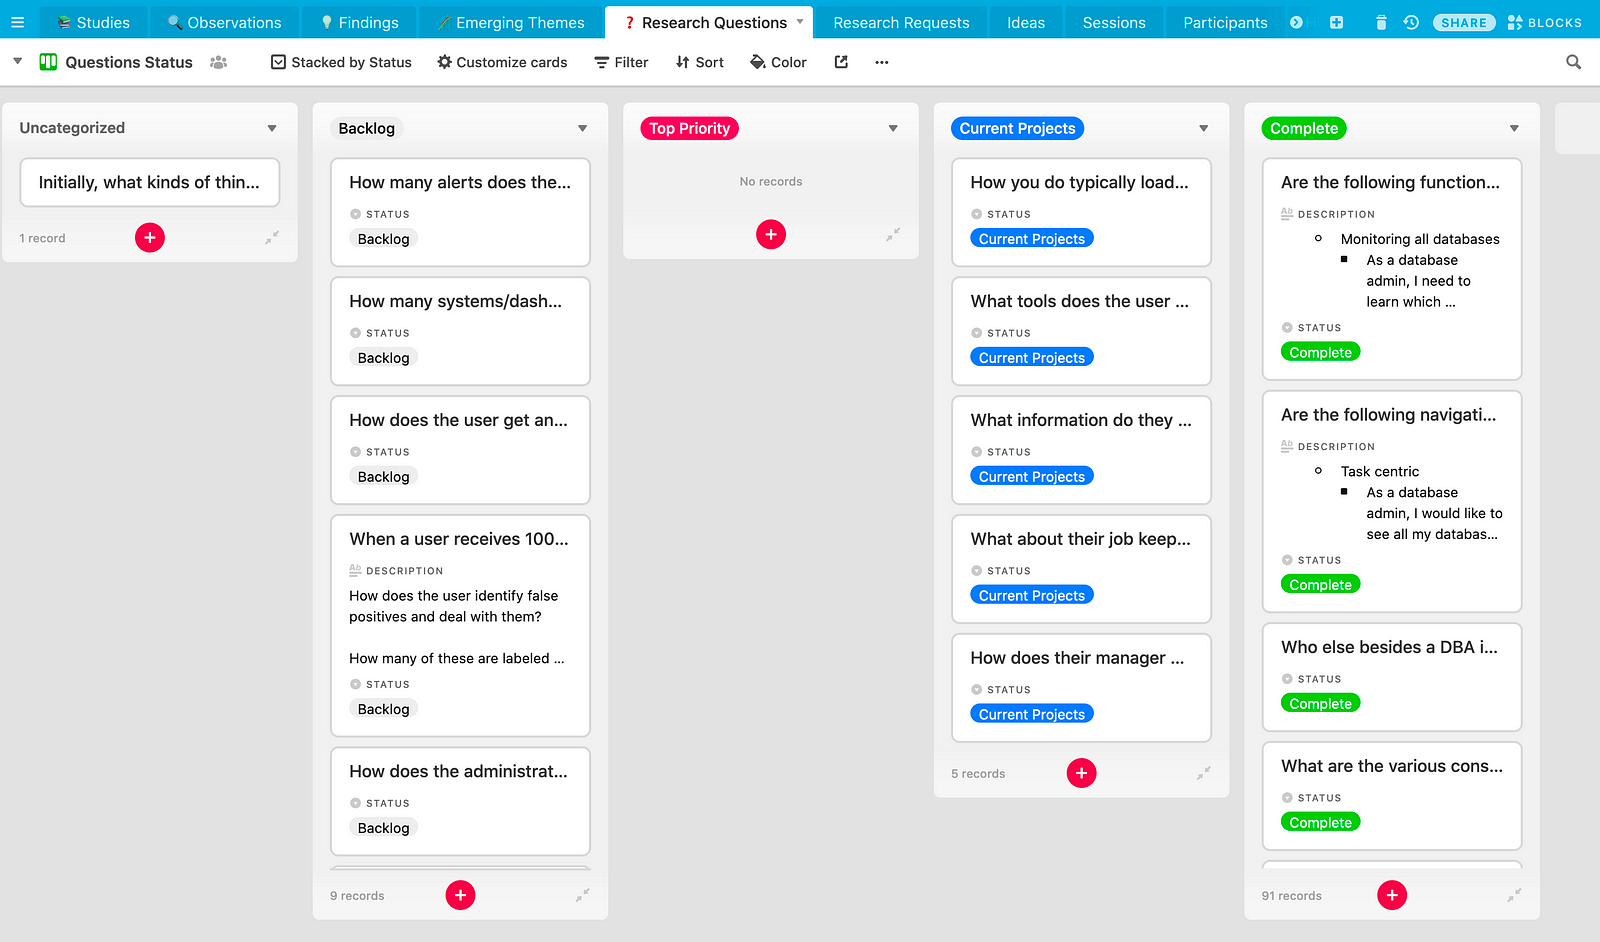
When someone views a research question, they’re not just looking at the question itself. They’re able to see what study it’s connected with and go in and learn more.
Managing research intake requests and questions
As a researcher, I don’t work as deeply on the product as my colleagues in design and development do. They unearth very specific problems and questions that research can find out for them.
I try to make getting research support as easy as possible. I do that by utilizing Airtable forms, which lets you collect information from anyone and it automatically goes into your base.
Intake requests
Anyone can fill out a research request.
I’ve had product managers, designers, and developers request research. I point them to this form so that I can then prioritize my research.
As you can see in the screenshot below, I ask them for as much detail as I can, but they don’t have to fill it all out since nothing is [technically] required.
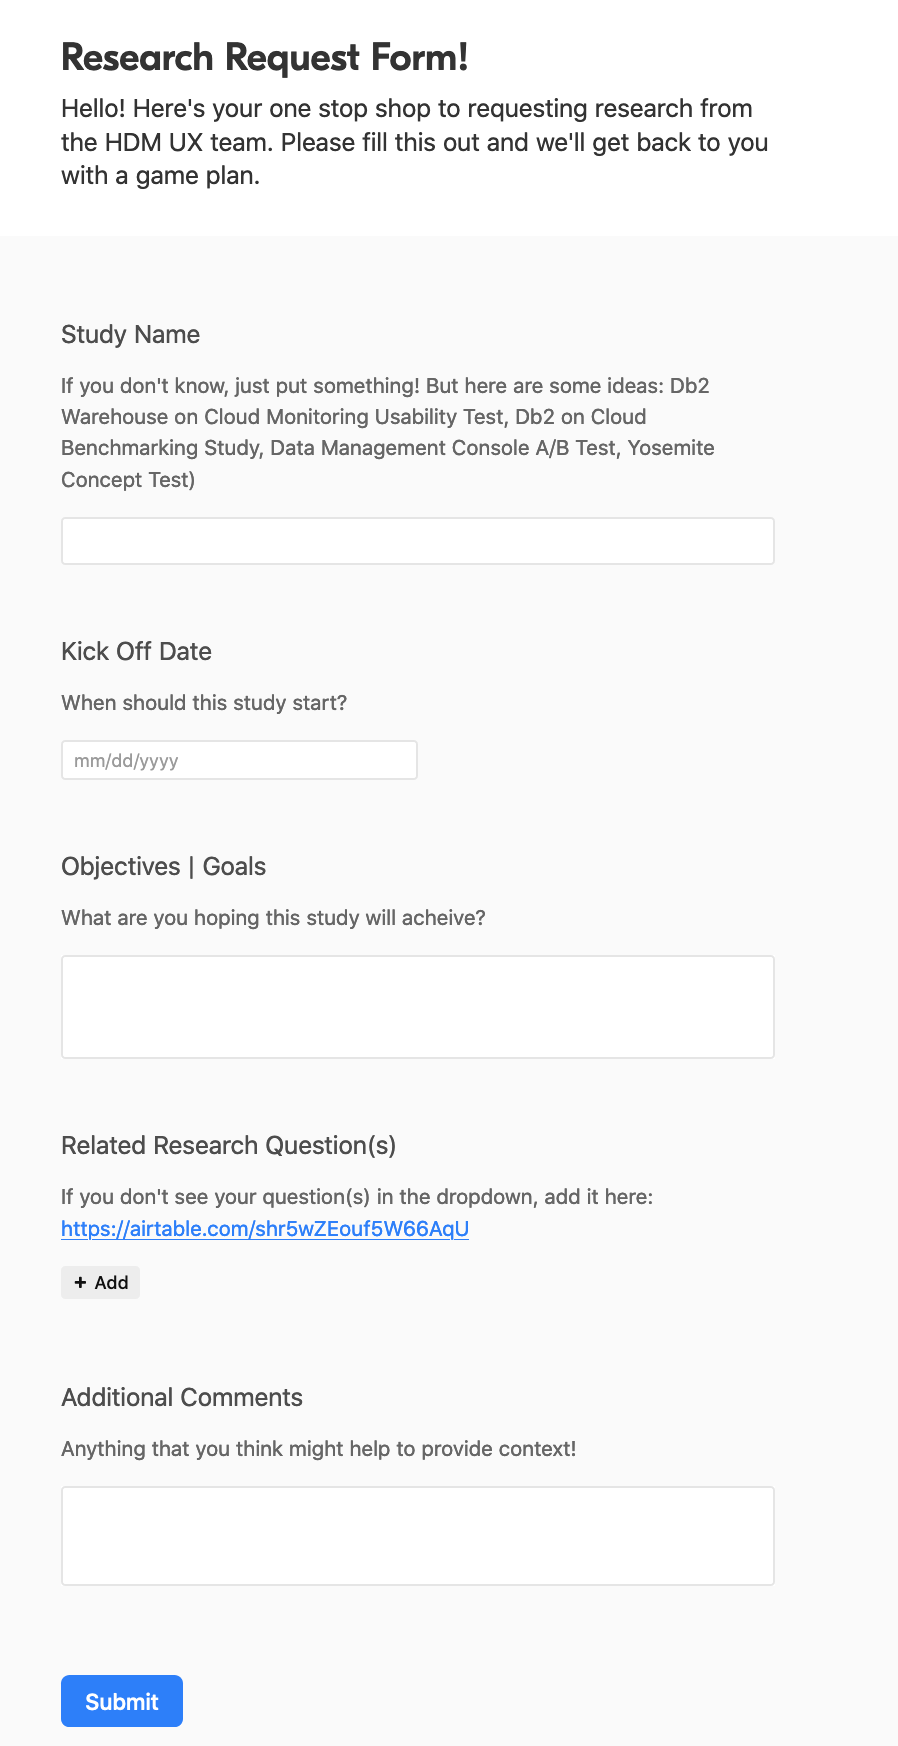
The research request will automatically go into our project backlog and then we can evaluate our priorities all in one place.
Research question submissions
Anyone can submit a research question.
Submitting a research question can be less daunting than requesting a whole project. It’s a nice way to submit a question when you think of something, but not have to go through the whole effort of writing up a request.
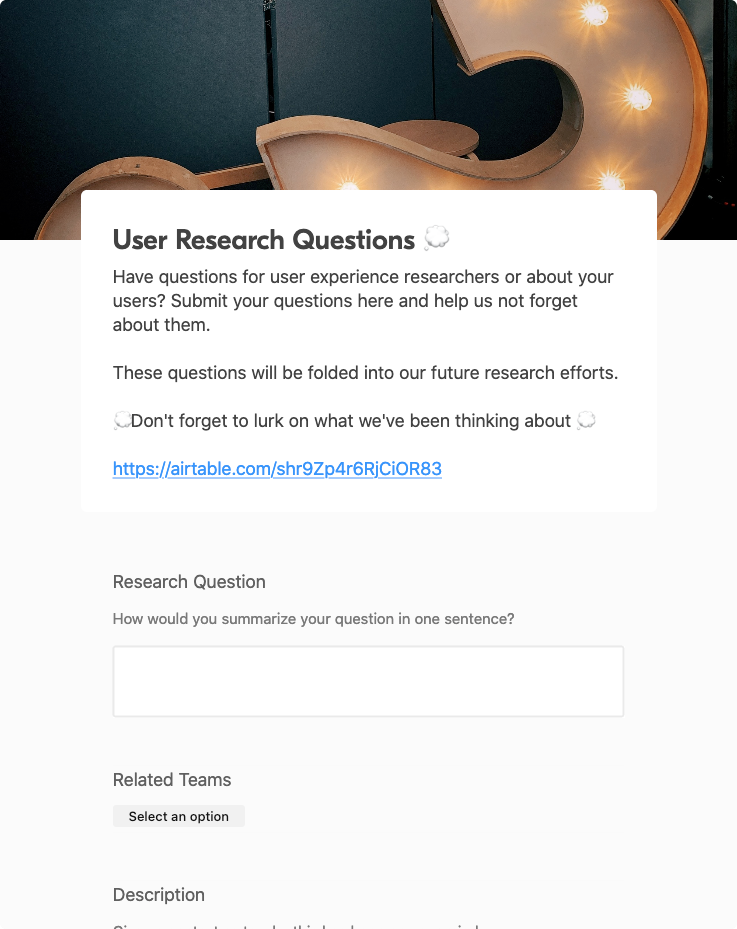
With this approach, you can accumulate and manage questions that can help fuel future studies.
It also allows me, as the researcher, to link the questions to a particular study so that folks can find the relevant report and session details so they can dive in and learn more.
Centralizing knowledge and data
I used to write all my research notes in various formats. Now, with the research repository, I am able to store research observations, findings, and session details in a centralized location, regardless of the type of study.

Observations
For me, observations are basically research nuggets. It’s an interesting quote, action, or something otherwise notable regarding the user.
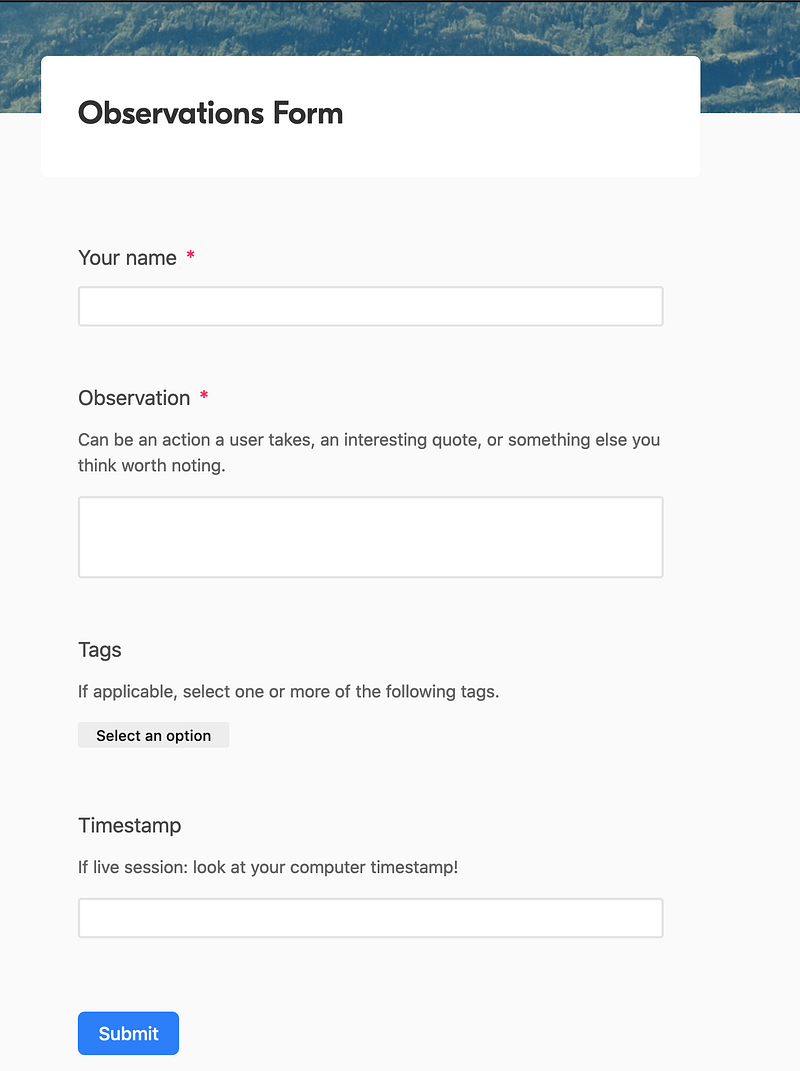
When I first created my “Observations Form,” my idea was for observers of my sessions to write down specific user quotes during a session.
If you read my last article about notetaking with Airtable, this form is much simpler because I was having a hard time getting non-researchers to write in such a structured format where the fields followed the discussion guide closely.
The thinking with the simpler Observations form was that they’d submit the form after writing each quote and providing a timestamp of when a user said that quote.
In reality, session observers would take long-form notes in one form. Over time, I realized my Observations section was getting kind of messy, so I created another tab called “Notes” and have all the notes go there.
But I digress.
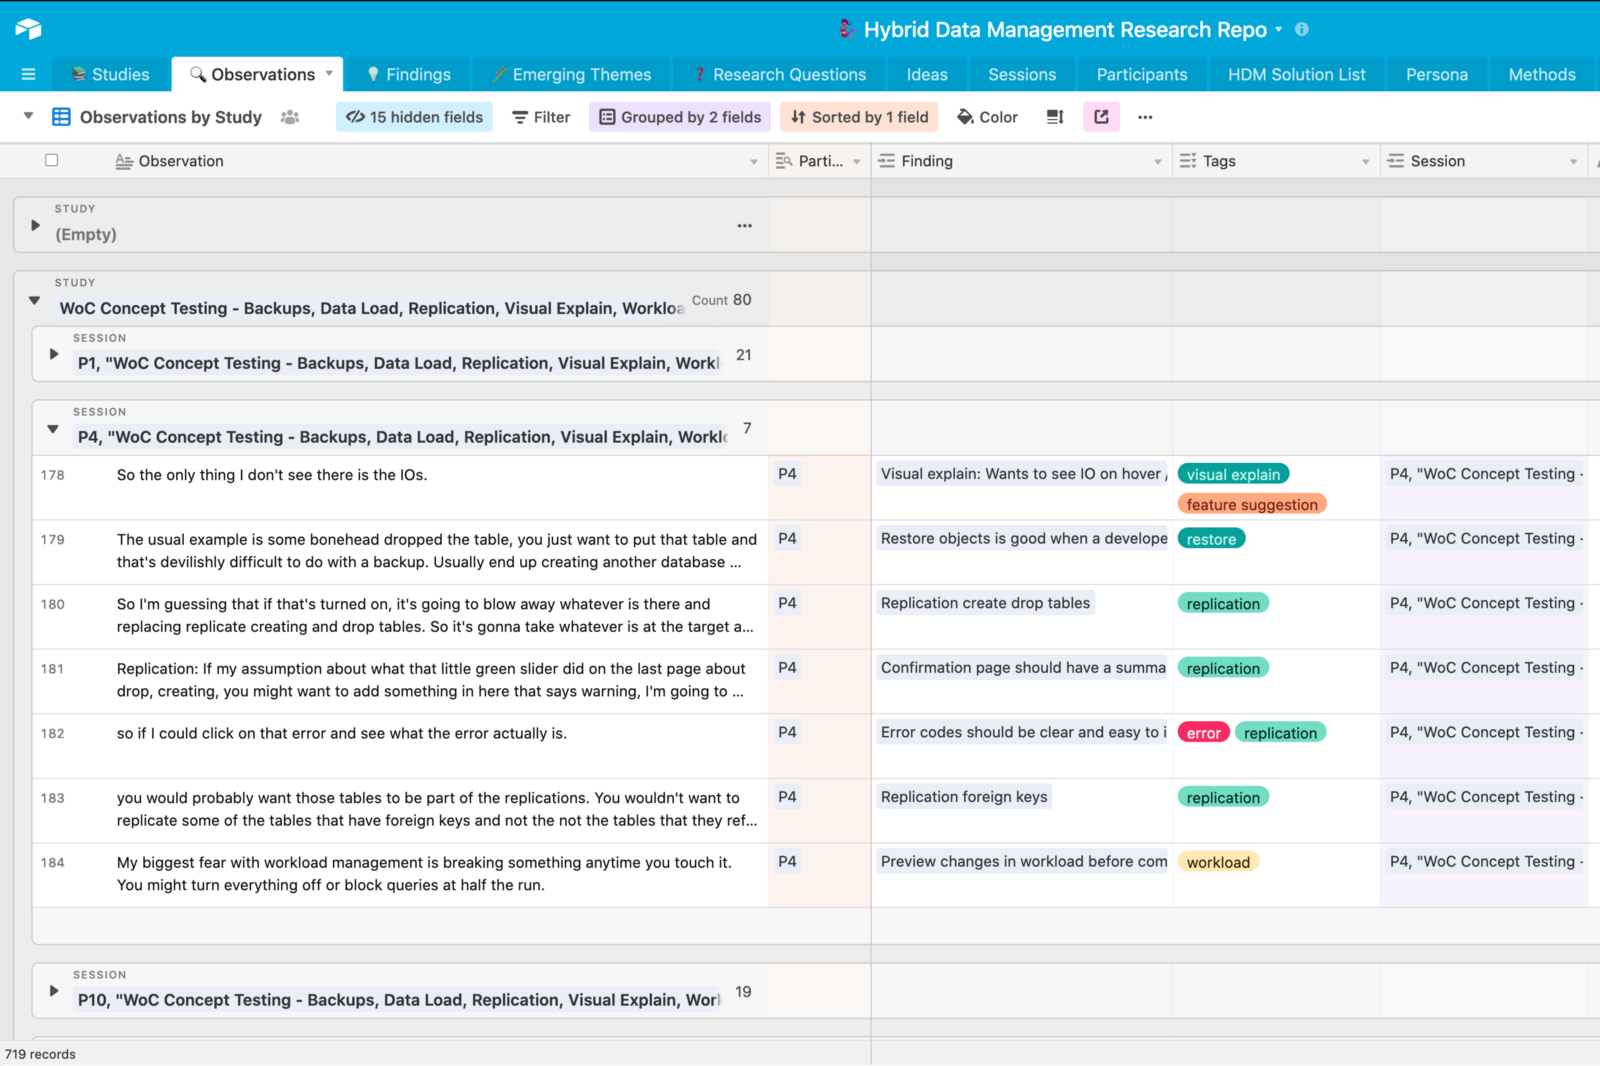
I create these observations by reading through session notes and transcripts and pulling out key quotes as separate line items in the spreadsheet.
The power of this emerges when you connect these observations to an individual participant session and you can easily track who said something.
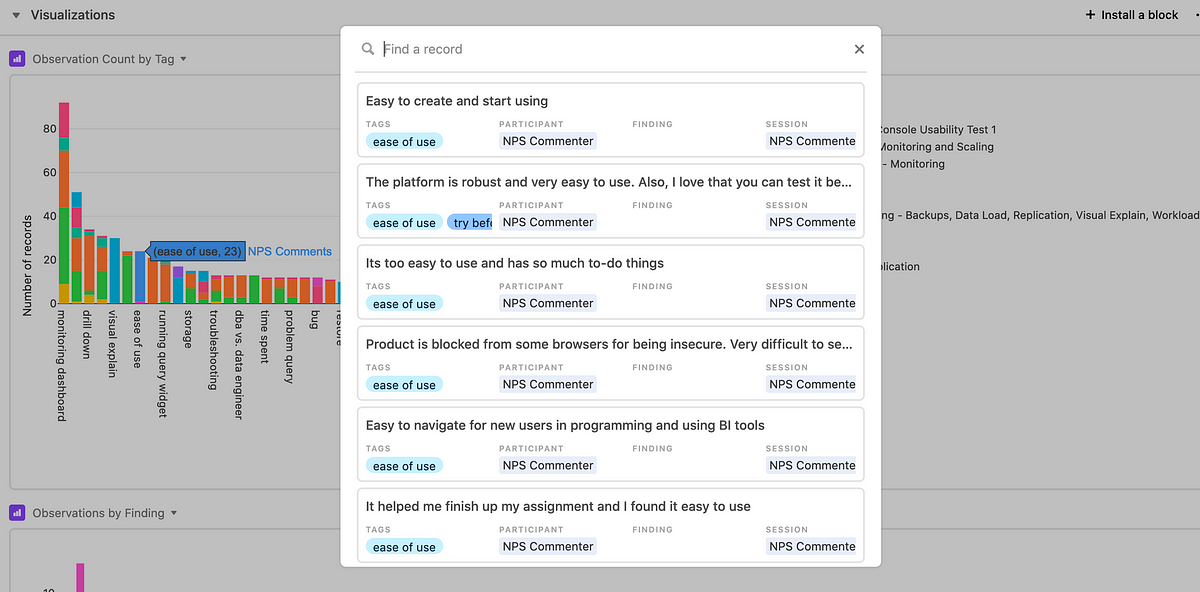
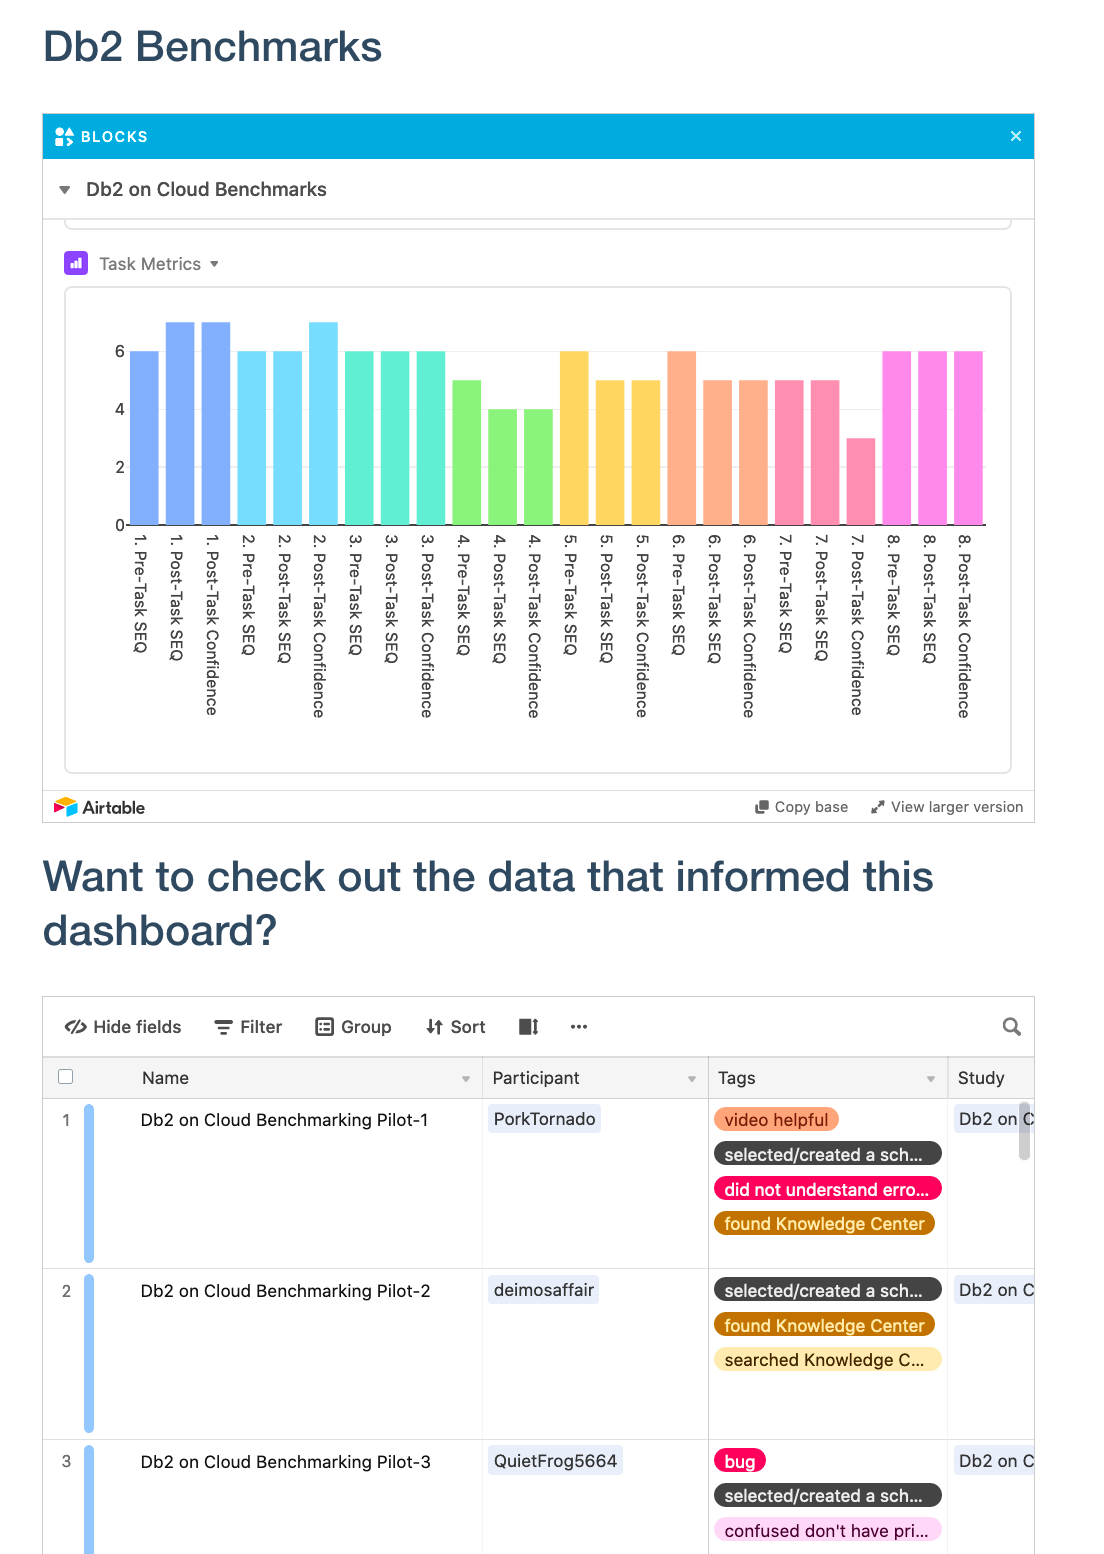
You can also create tags for each observation, which you can later sort by. For me, I think of tags as a feature or area that I’m having the user look at.
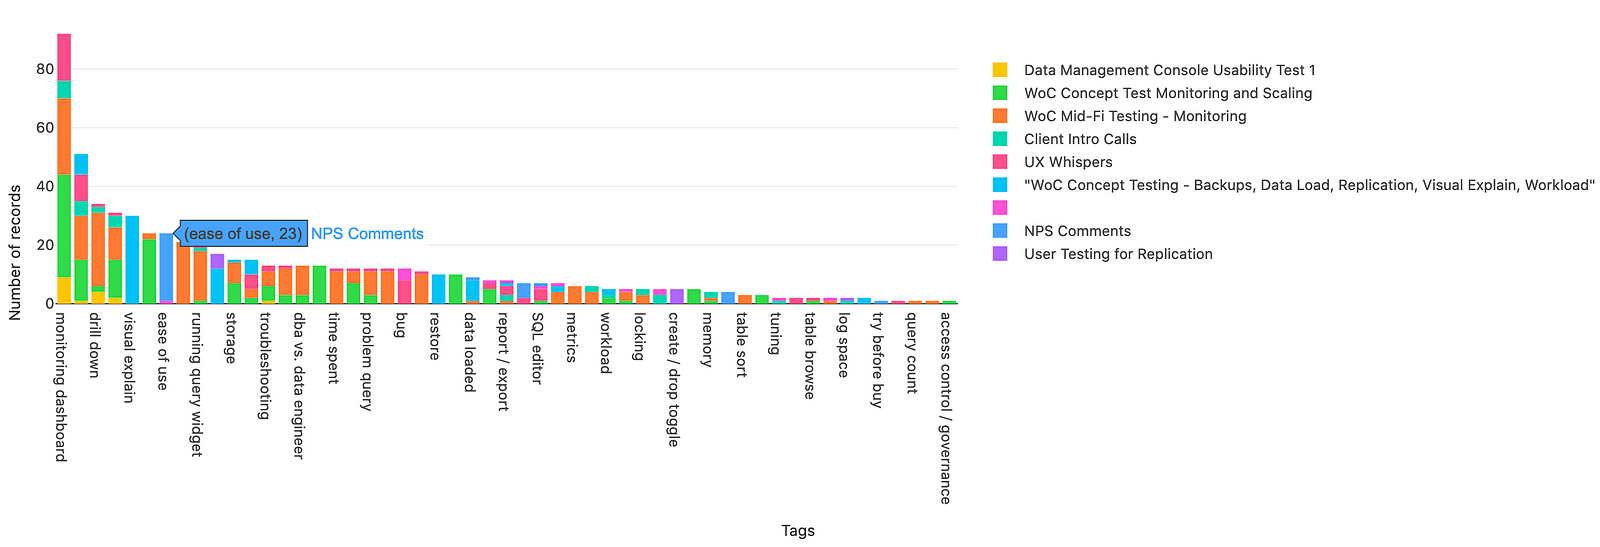
After tagging observations, you can leverage charts to create a visualization of how many comments you have for a specific feature. I have the bar chart grouped by the specific study. You can see that I’ve done a good number of tests related to monitoring dashboards!
Findings
As you collect observations, you begin to notice patterns and trends. In the repository I manage, I call these findings.
The great thing about findings is that they go beyond a particular study.
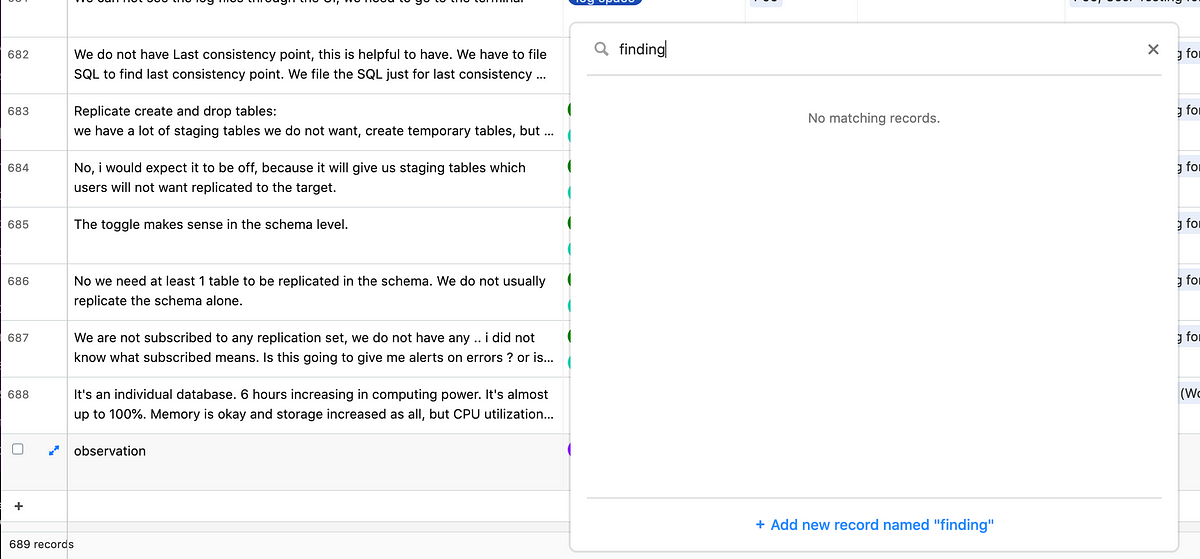
While I’m working on creating observations, I’ll add a finding into the “Findings” column in the “Observations” tab. Since I linked it to the “Findings” tab, it will be automatically created.

After creating the initial finding, I can then search and add that finding on subsequent relevant observations.
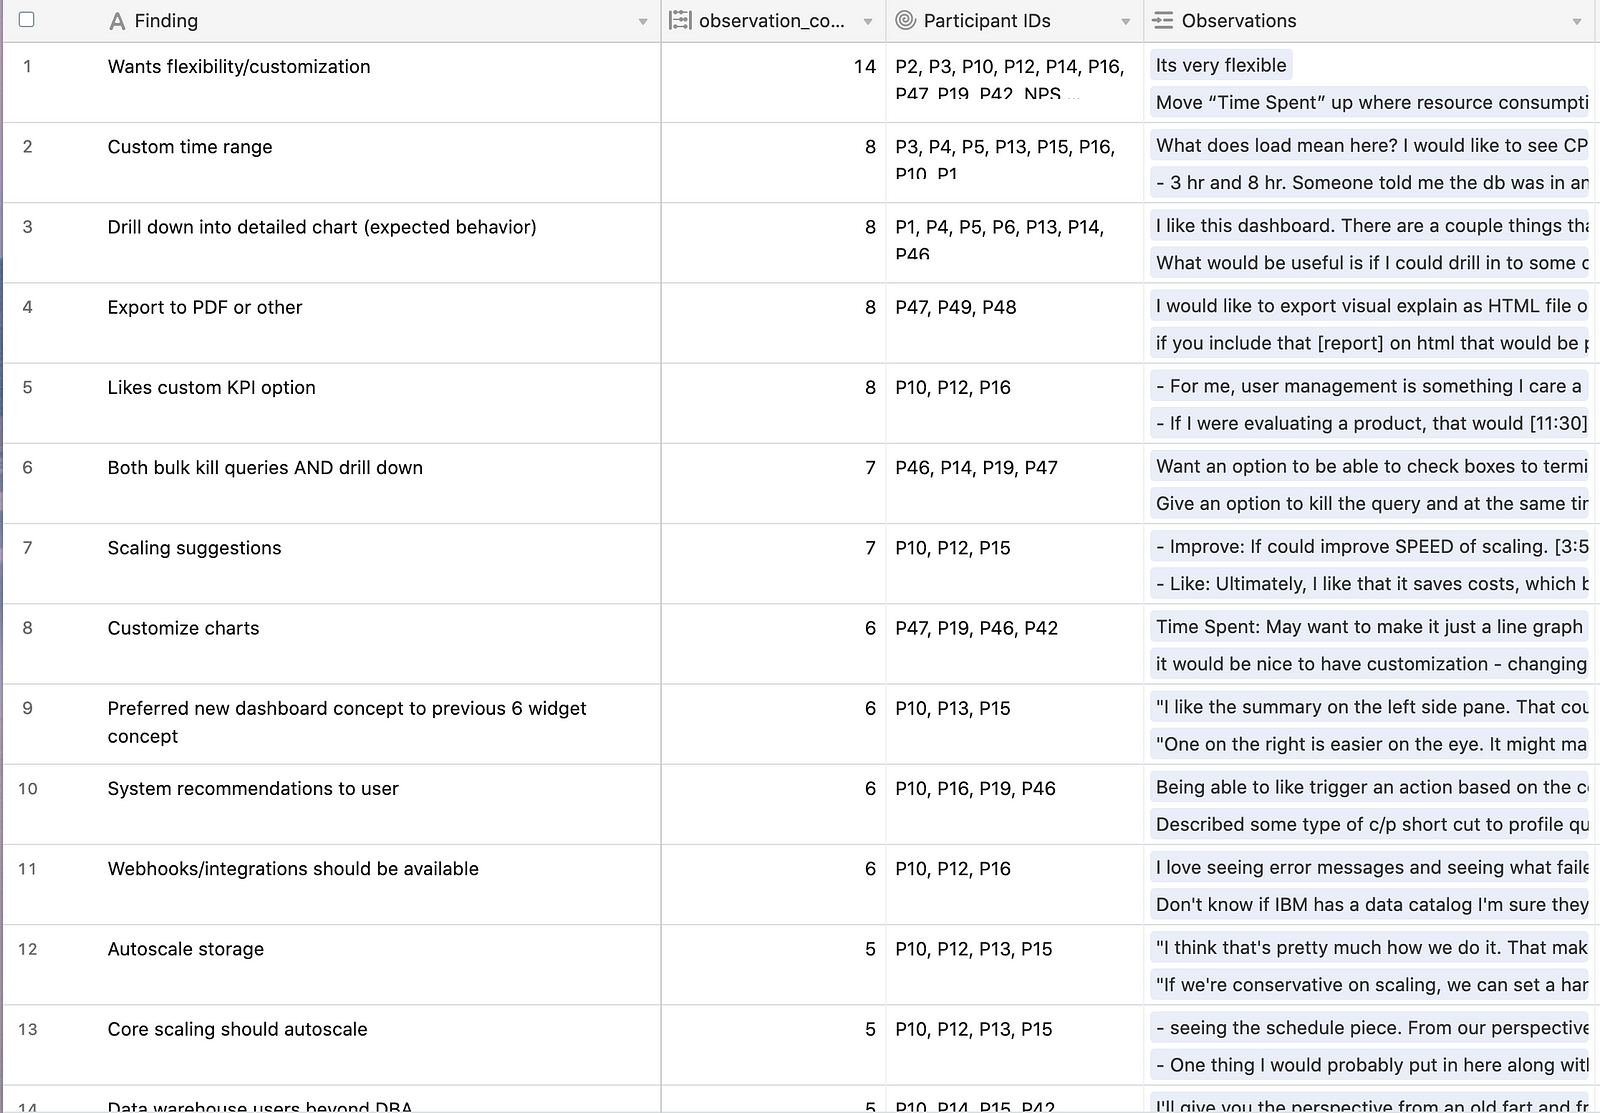
Having observations linked to findings like this gives you a lot of power!
You can start tracking findings that go beyond an individual project. In a presentation, you can tell your stakeholders exactly how many people requested something and how many times it was mentioned. I used to go and count this manually.
Sessions
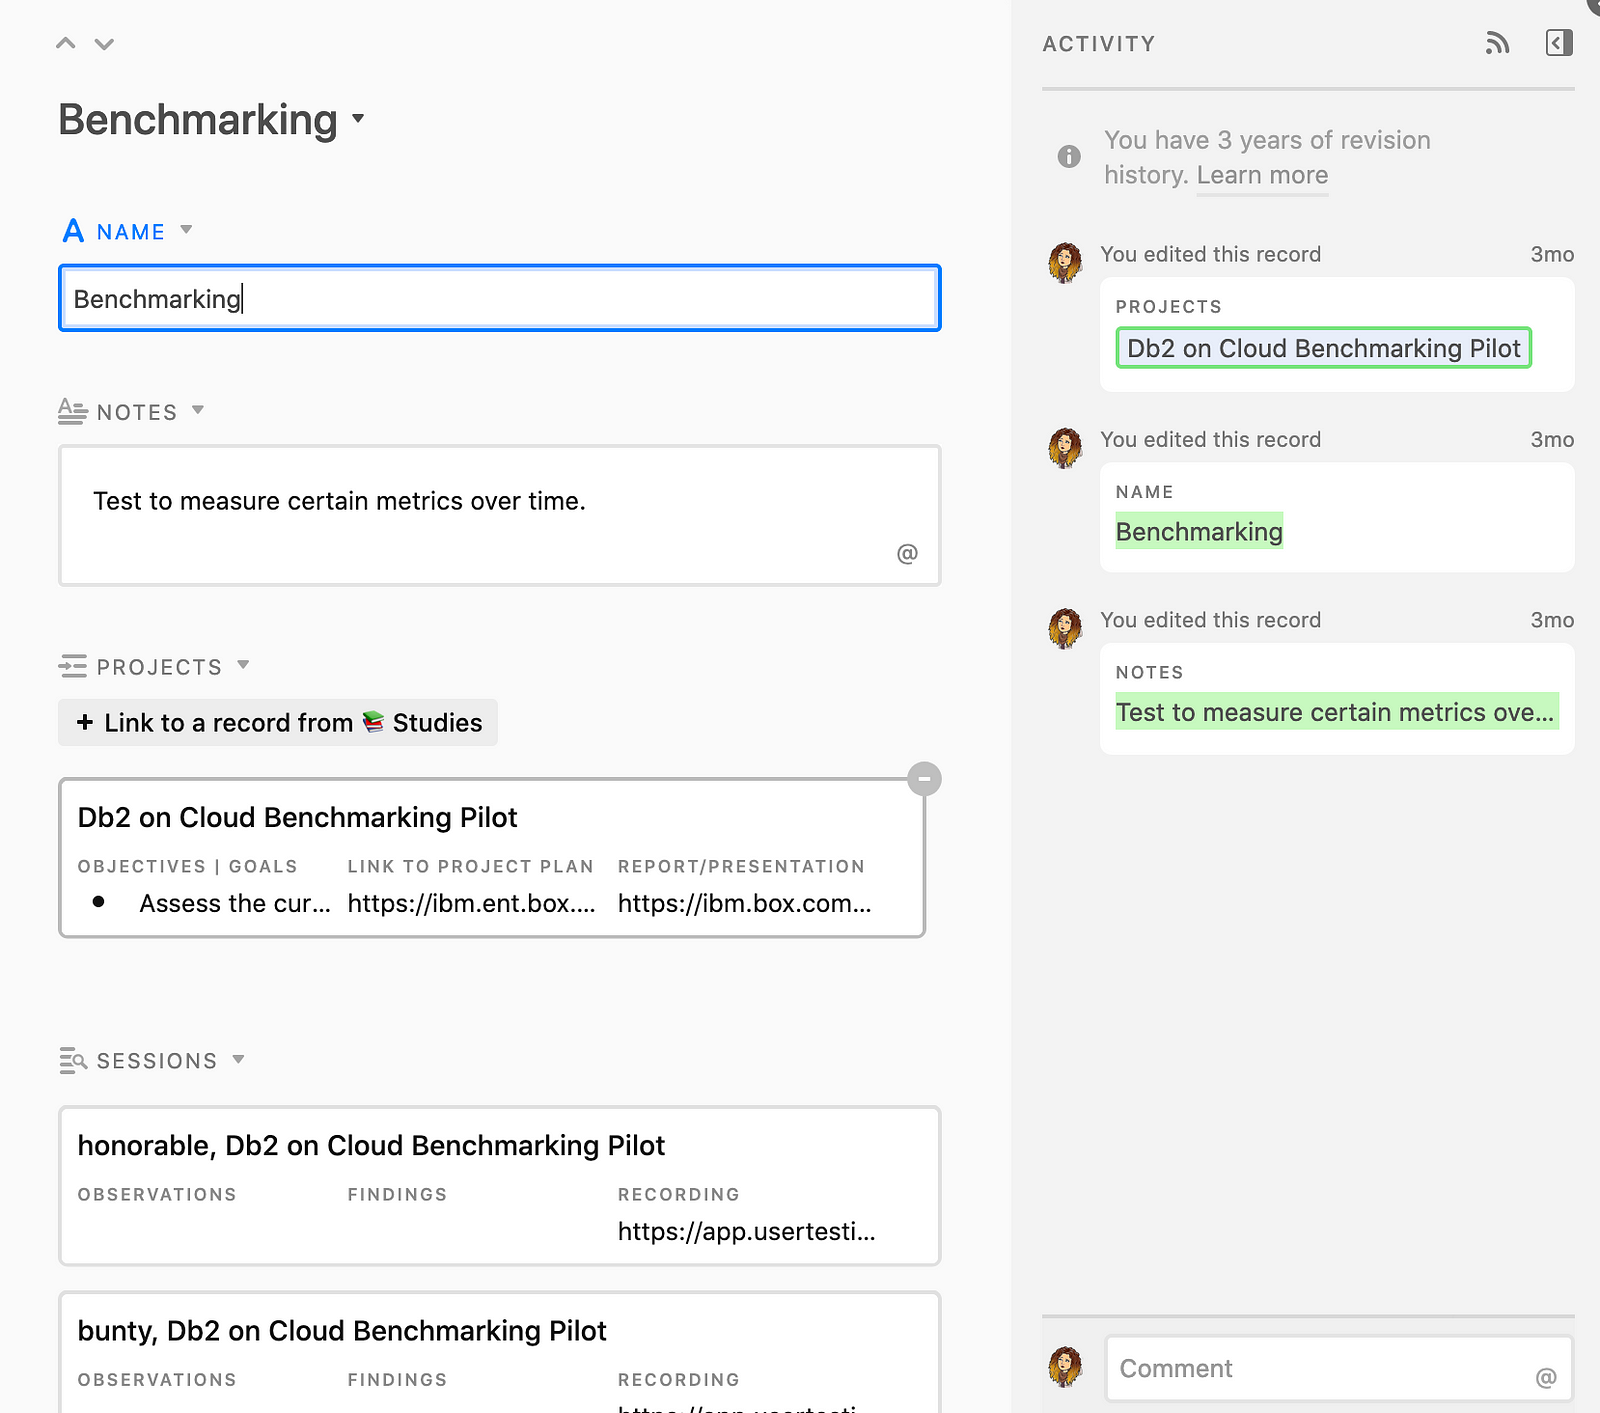
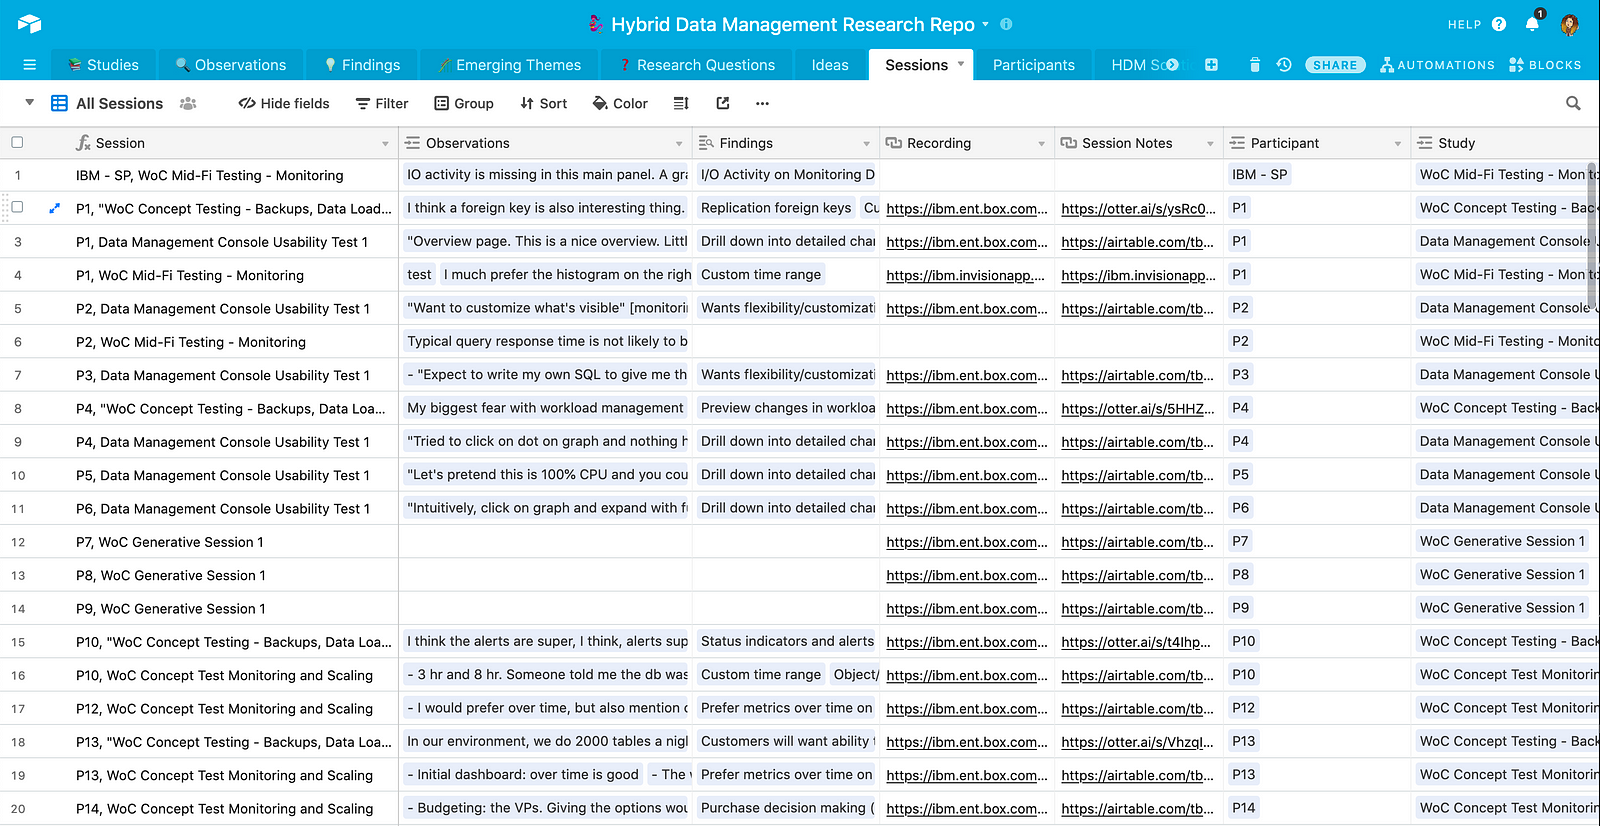
When I create an observation, I am always sure to link it to a research session in the “Sessions” tab.
Sessions is the source of truth for detailed information on individual research sessions. It compiles key data such as participant information, a link to the anonymized recordings, and a link to the de-identified session notes (or transcript).
Once this data is in there, you never have to leave Airtable to dig around to find that information.
I also find it useful to note the participant’s helpfulness here. That way, I can go back and reference that when I’m planning for future sessions.
As long as I populate the participant ID and the study name here, I’ve set it up so that I have lookup fields that will automatically connect that same data to the Findings tab.
There’s a lot more to participant management than I’m going to get into in this particular article, but I do want to call out that I set up the repository so that we link to the participants and yet we also don’t share sensitive PII to those who do not have permission to view it.
Having all of this in one place makes the data management much easier to handle so that you can delete data as needed and ensure that there aren’t copies anywhere else.
Challenges
Let’s take a deep breath. Whew. That was A LOT.
Sending someone to a database with 16 different tables is quite daunting for them. I have a guide I made for how to use it, but it’s still just A LOT.
Needless to say, there’s a learning curve both for consumers of the data and for people trying to replicate something like this.
Plans for the future
Making it user friendly
Eventually, I’d like to create some kind of front end for this. I know that I can’t exactly replicate WeWork’s searchable repository tool, Polaris, by myself.
What I can do, though, is embed aspects of the repository into a wiki or site I make myself. For instance, I can embed the “Search” app so that people can search. I can embed a dashboard for something more visually appealing.
Better taxonomy
If you looked at my screenshot for Findings and were confused, you’re not the only one. The way I wrote those findings mostly only makes sense to me.
I want to take the time to do something like what Uber does with their research repository and require that Findings all follow a specific format to make them more actionable.
How can I replicate this?
The way I’ve formatted my Airtable repository is a mash-up of the Airtable User Research template, the Polaris UX Nuggets base, and learning from what my fellow researchers at IBM are doing.
Honestly, I’ve only scratched the surface in this article, but I’ve covered the key use cases I think you might need to get started.
When I created this repository, I couldn’t find details like this on how repositories were structured so I hope this will help give you a starting point.
Would love to swap stories with anyone!
If you liked this blog and haven’t tried out Airtable, consider using my referral link! It gives me a little Airtable credit and costs you nothing.
Originally published on the Research Operations Community Medium Blog.
Special thanks to my fellow early adopters of Airtable at IBM: Hannah Moyers, Anna Obikane, Philip Begel, Jenny Hwang, and others. If it weren’t for you, I’d still just be taking notes in Airtable.
Rachel is a user experience researcher for IBM’s suite of Db2 products within the Hybrid Data Management portfolio in the Cloud Data and AI business unit.
The above article is personal and does not necessarily represent IBM’s positions, strategies or opinions.

![11 Best AI UX Tools of 2024 [By Category]](https://renaissancerachel.com/wp-content/uploads/2026/06/best-ai-ux-tools-clean-768x402.jpg)