
18 Best Analytics Software of 2024
Let me introduce you to the world of analytics software: from customizable AI that sorts and analyses the data to data visualization tools; we’ll cover everything you need to know when choosing the best data analytics software for your needs.
Whether you’re a data scientist or a novice in the field, these tools for data analysis will be the thing to change the game and save you time.
What are the 5 types of data analytics?
The 5 types of data analytics are descriptive, diagnostic, predictive, perspective, and cognitive data analytics.
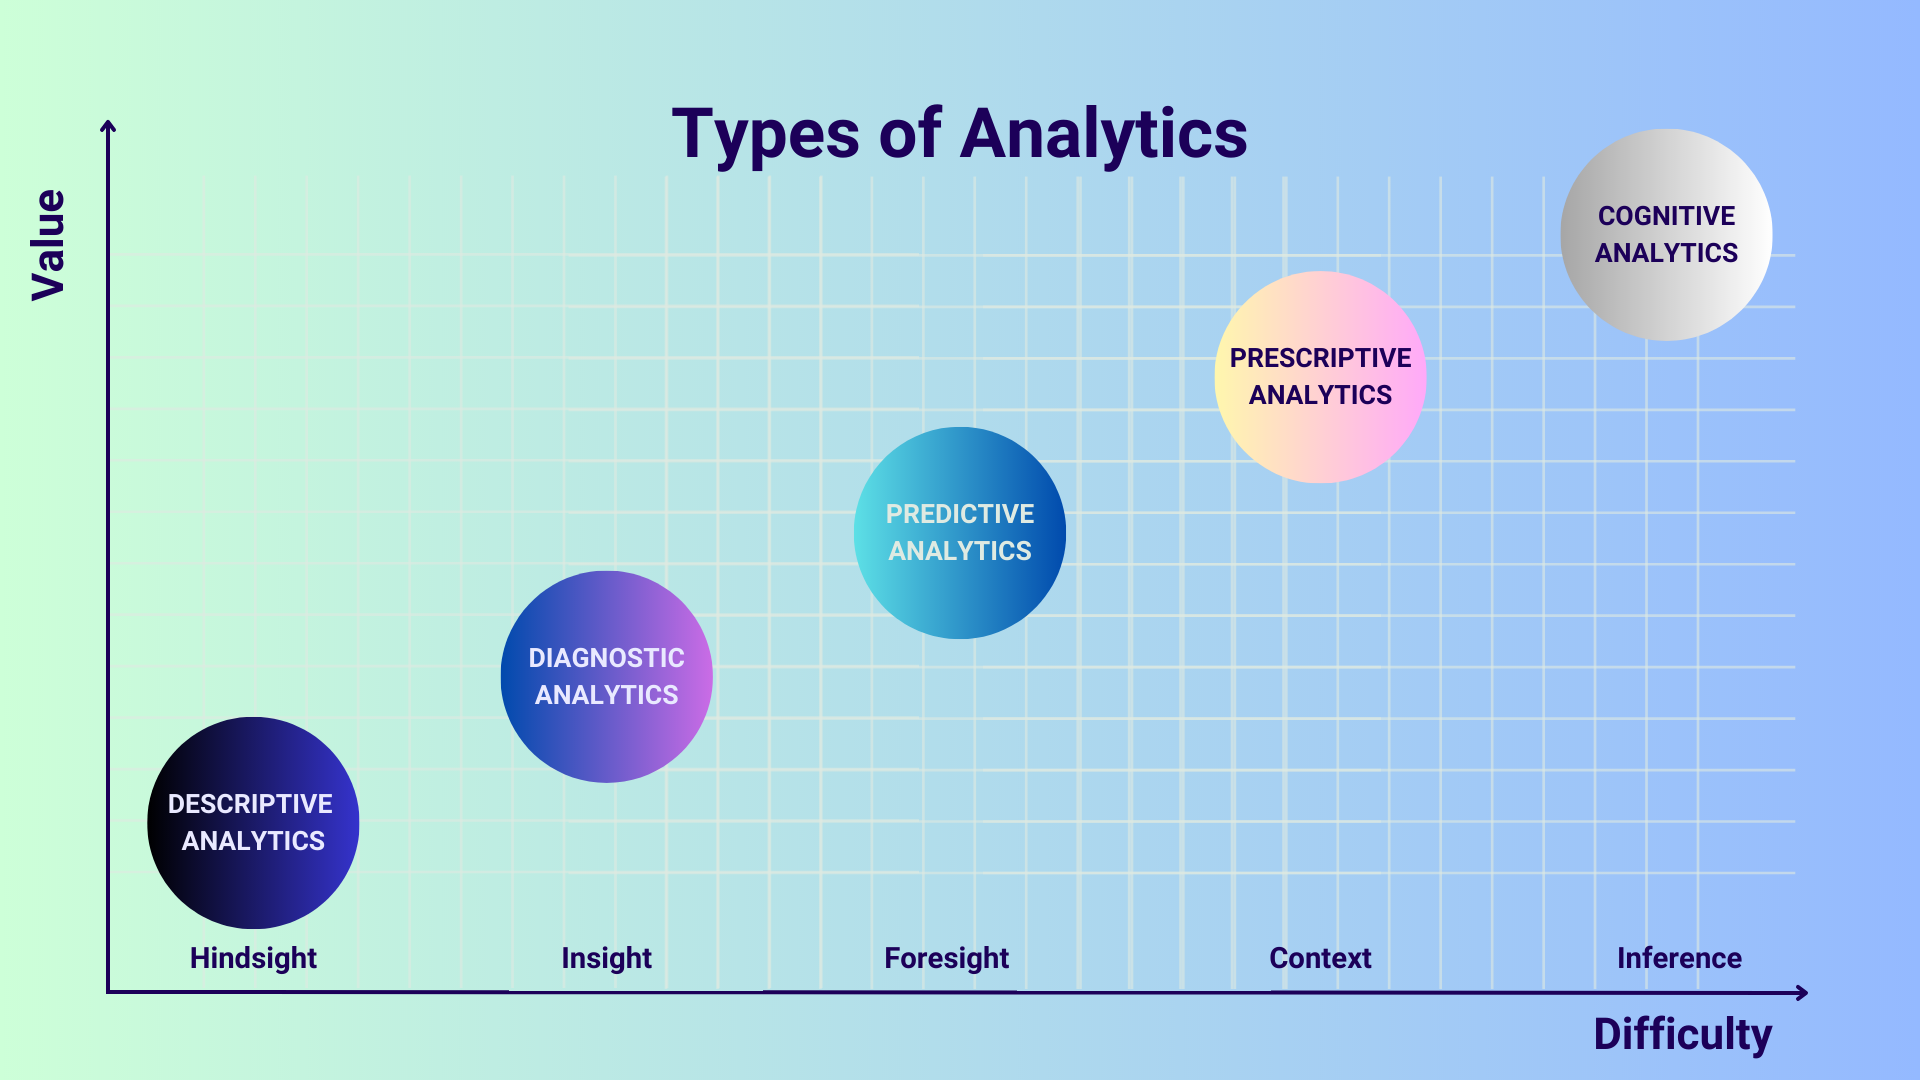
Descriptive Data Analytics
Descriptive analytics is the data analysis process that includes examining past data(describing, illustrating, or summarizing data points) in order to gain insights and understand what has happened in the past. It is a method for finding connections and patterns in both recent and old data. Descriptive data analytics is used to summarize and describe data in a meaningful way. By analyzing past data with data analytics tools, you can better understand past performance, customer behavior, and market trends.
Diagnostic Data Analytics
Diagnostic analytics is the process of identifying why something has happened in the past. To identify the underlying cause, this type of analysis looks at trends and correlations between variables. After descriptive analytics establishes what occurs, diagnostics analysis is a logical next step. Diagnostic data analytics is used to investigate and understand the root cause of a problem, whether it’s a drop in sales, an increase in customer churn, or a decrease in website traffic.
Predictive Data Data Analytics
Predictive analytics is the type of analytics to use data, statistical algorithms and techniques usually used in machine learning in order to deduce the possibilities of future outcomes, all based on past data. This type of analysis can be used to forecast customer behavior, identify potential risks, and optimize business processes.
Perspective Data Analytics
Perspective analytics is the process of analyzing data from different perspectives in order to gain valuable insights and understand complex relationships between variables. This type of analysis can help you and your business identify hidden patterns and connections in the data that might otherwise be missed.
Cognitive Data Analytics
Cognitive analytics is the process of using artificial intelligence, AI, and machine learning to analyze unstructured data such as images, video, and natural language. This type of analysis can be used to identify patterns and trends in social media data, customer feedback, and other unstructured sources of data.

What is the best analytics software?
The data analytics software that is the best for you is the one that fits your exact needs, but there are some key features that the tool you use for your data should have. When choosing the analytics tool, focus on key features such as data visualization, data integration, and predictive analytics.
It’s important to distinguish between software with similar features by evaluating their ease of use, scalability, and customer support. In this article, we listed the best software on the market today with their key features, as well as their pricing and pricing models, which often influence the decision.
It’s worth noting that many of these products offer multiple types of data analytics, and that this categorization is just one way of grouping them.
We’ve organized our list of data analysis software by the types of data analytics mentioned in the previous section.
Descriptive Data Analytics:
Google Analytics: Best Free Data Analytics Tool
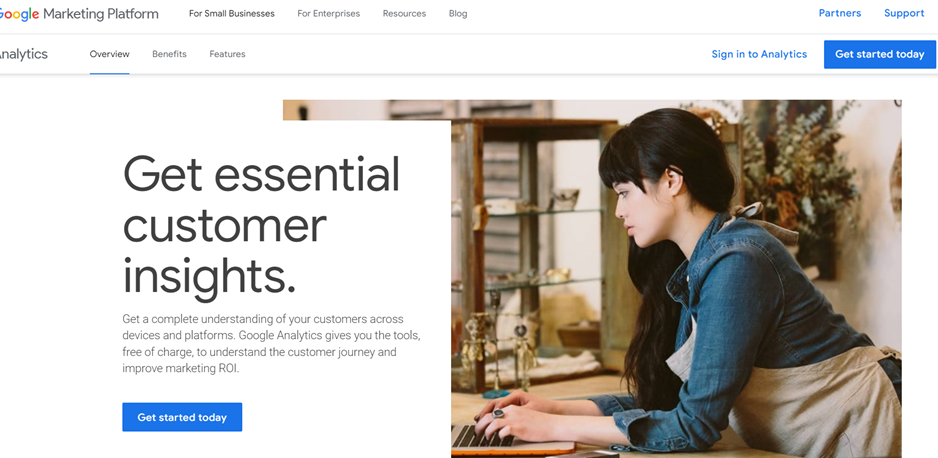
Overview
Google Analytics is a free tool that provides complete information to analyze data for businesses in one place. It helps users understand their site and app users through data analytics in order to check the performance of their marketing, content, products, and more.
Google Analytics provides unique insights and machine learning capabilities to make the most of users’ data. The software works with Google’s advertising and publisher products to deliver data and statistical analysis and better business results.
Highlights
- Google Analytics offers essential customer insights to understand the customer journey and improve marketing ROI. It provides a complete understanding of customers across devices and platforms.
- The data analytics platform includes a reliable measurement foundation with built-in automation, intuitive and flexible reporting, cross-platform attribution, and more. It provides an easy-to-use interface and shareable reports, allowing users to analyze their data quickly and collaborate with their teams.
- The data analytics software also offers built-in technical support and a global infrastructure that delivers secure, accurate data across users’ sites and apps while staying fully under their control.
- Google Analytics is designed to work with other Google solutions to get a complete understanding of users’ marketing efforts and enhance performance. Users can connect Analytics with Google Ads, Search Ads 360, Display & Video 360, Google Cloud, and Google Search Console to improve their marketing ROI.
- The data analytics software also helps users discover new and predictive insights from their data using Google’s machine learning.
Pricing
- Free of charge, with the option to upgrade to the priced full suite of tools
- Google Analytics 360 Plan starts out at $12,500 per month
Bottom line
Google Analytics is best suited for businesses of all sizes looking to understand how their customers engage with their business to deliver better experiences and drive results. This data analytics tool can be used to get insights into marketing campaigns, identify issues with website traffic, and understand how customers interact with the website without breaking the bank.
Mix Panel: Best Scalable Solution
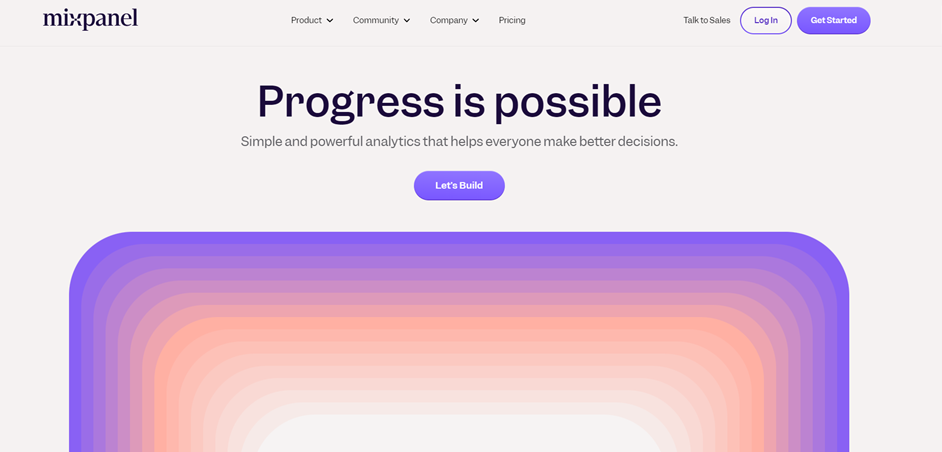
Overview
Mixpanel is a powerful data analytics tool that provides simple and effective solutions to data-driven decision-making. It is designed to help teams see every aspect of the customer experience clearly, allowing them to make changes that work.
Highlights
- Mixpanel offers an intuitive user interface, allowing users to explore data without the need for SQL. Users can easily set up metrics to measure growth and retention, slice and dice data to uncover trends and receive live updates on how people are using their app.
- One of the standout features of Mixpanel is its scalable infrastructure. Mixpanel grows with your data volume, making it a useful tool for both new businesses and Fortune 100s.
- Users can stream data directly from any digital product using a Mixpanel SDK.
- The data analytics tool also offers developer documentation to guide users in choosing the best option for their infrastructure.
- Additionally, Mixpanel integrates with a growing number of CDPs, including Segment, to seamlessly integrate analytics into any tech stack.
- Users can also get trusted data from their warehouse using Reverse-ETL tools or the import API and democratize analysis on their source of truth for all teams.
- Mixpanel lets you explore data freely, ask questions and dig deeper, understand hidden patterns beneath a trend, and catch regressions.
- Users can monitor growth and engagement, analyze retention, and make changes that lead to customer loyalty.
- Mixpanel empowers teams to explore their data and understand what’s working or not without delays or the need for SQL.
Pricing
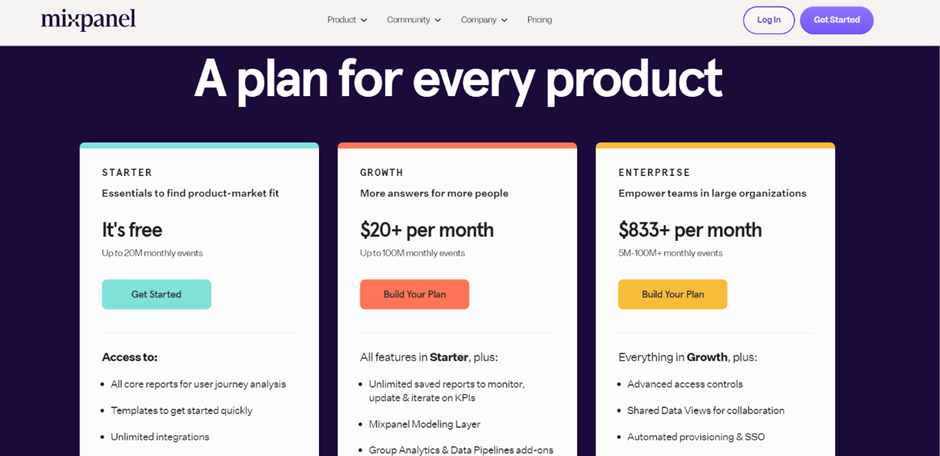
- Free Plan
- Growth Plan from $20 per month
- Enterprise Plan from $833 per month
Bottom line
Mixpanel is best used by those who want to make data-driven decisions in real time. It is intended for those who want to better understand the data and use it to drive their business forward, regardless of the budget for data scientists and data analysis tools.
Segment: Best for Centralizing Data
Overview
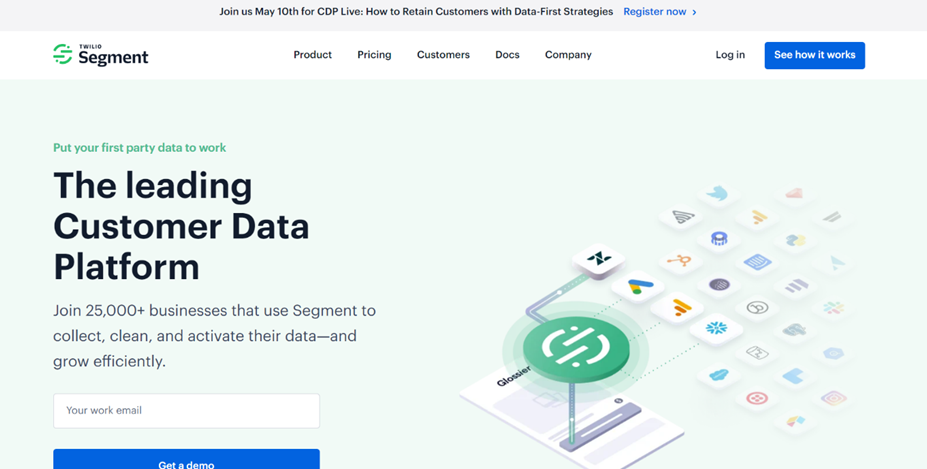
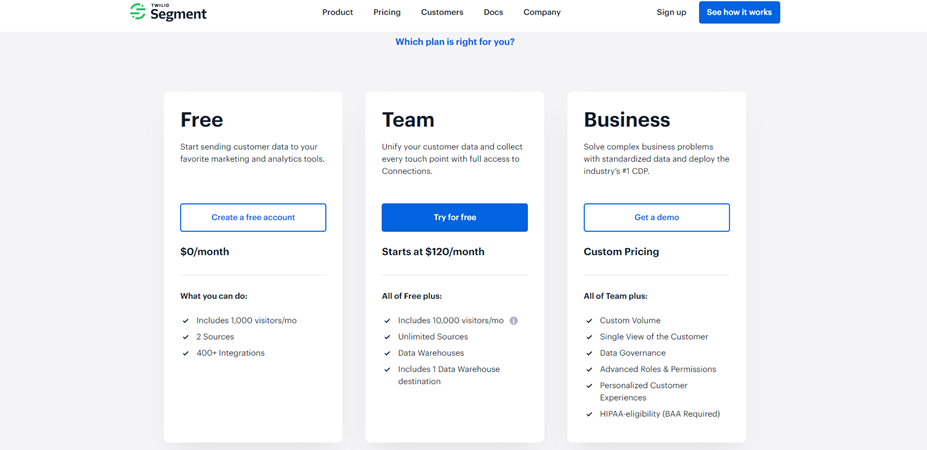
Segment is a leading customer data analytics platform that helps businesses collect, clean, and activate their first-party data. It is trusted by over 25,000 companies and provides a complete, data management toolkit for every team in a company.
Segment collects events from web and mobile apps and offers a single view of the customer to marketers, product managers, and engineers. This enables teams to deliver personalized, omnichannel campaigns to real-time targeted audiences from a centralized data integration platform without relying on other teams (almost like one of the best research repository tools).
Highlights
- One of the key features of Segment is its ability to provide a complete view of the customer, unifying their touchpoints across all platforms and channels.
- Additionally, Segment’s real-time audiences allow teams to target the right customer with the right message at the right time. This feature also enables teams to build audiences and create real-time campaigns without relying on other teams.
- Another standout feature of Segment is its ability to activate over 400 marketing tools in real time, making it easy for teams to deliver unified, personalized experiences.
- The data analytics tool also offers best-in-class SDKs, one API to collect analytics data across any platform, and a query in SQL.
- Segment enables users to deploy custom functions, build any integration with just ten lines of JavaScript, and align marketing, engineering, and analytics teams with a shared data dictionary.
Pricing
Bottom line
Segment is intended for marketers, product managers, and engineers who want to empower every team with good data. The software is best used for collecting and unifying customer data from various platforms and channels, creating real-time audiences, and delivering personalized, omnichannel campaigns. It is also useful for launching products with the best analytics, A/B testing, and data warehouse tools and building a privacy-first data pipeline while accelerating compliance with GDPR, CCPA, and other regulations.
Medallia: Best for Customer Feedback Analysis
Overview
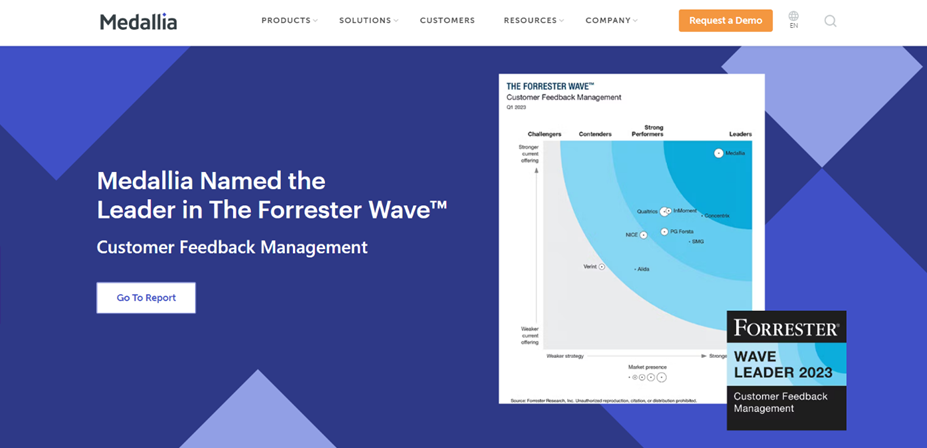
Medallia is a customer feedback management software designed to provide organizations with a rich 360-degree view of their customers. It enables businesses to get insights on customers from social media, speech analytics, ticketing systems, digital behavior, and transcripts, allowing them to prioritize actions and predict customer behavior (you can get also these transcripts utilizing some of the best transcription tools). Medallia’s AI and its machine learning algorithms and learning engine are tailored to experience data, and they provide data-driven guidance at critical decision points, making it easy to detect new trends and predict customer needs.
Medallia’s software enables businesses to influence experiences as they happen by providing insights in real time to the right people in the organization.
Highlights
- The software is highly flexible, providing out-of-the-box integrations for common systems and powerful, robust APIs and ETL to harness all of the data. This makes it easy to work with the tool and take action to transform experiences.
- One of the standout features of Medallia is Athena, an AI technology layer that turns customer, employee, and product journey data across a multitude of channels into a 360-degree view that drives action to improve experiences. With Athena, Medallia offers personalized reports, intuitive workflows, and AI-driven topic and theme-based alerts that empower every employee, from the C-suite to the frontline, to take action on the root cause of issues.
- Medallia provides businesses with analytics that they can take action on, with no coding required. With its adaptive machine learning models that automatically improve over time, the tool reduces the operational burden on the team.
- The platform’s Athena Studio enables organizations to create custom AI models and analytics for unstructured data without any coding, making it easier for teams to build AI models.
Pricing
Available via request.
Bottom line
The software is best used for analyzing every experience, detecting new trends, predicting customer needs, measuring action impact, prioritizing action areas, and exploring themes in real time across any segment or data source.
Medallia is designed for businesses that want to understand, anticipate, and power proactive engagement at every interaction, and it provides analytics for every part of the business, including text analytics, speech analytics, journey analytics, prescriptive analytics, and benchmarking.
Alida: Best for Better Customer Experience
Overview
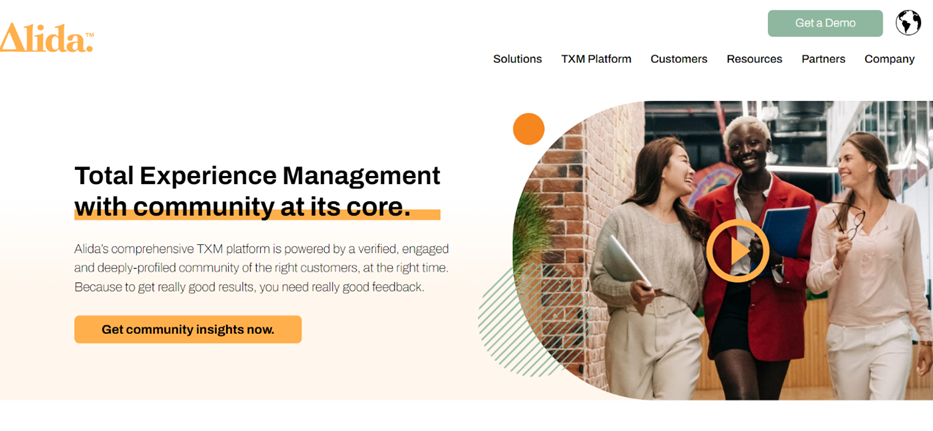
Alida is a comprehensive Total Experience Management (TXM) platform that delivers fast and reliable customer feedback at scale. It is a community-centered CX tool that relies on a verified, engaged, and deeply profiled community of customers at the right time to get the best feedback.
Highlights
- Alida offers reliable data and insights that regularly exceed 50% audience response rates, the ability to test and validate with broader representative audiences, agility and faster speed to insights to achieve better ROI, and customer communities built to achieve more profound relationships with customers over time. Alida is used by 176 million people globally, who have shared their insights through the platform to inform over 60,000 customer experiences and initiatives.
- Alida’s community-centric CX model is designed to set goals and design a CX strategy that embeds community at its core. The platform empowers businesses to access the right customers at the right time, analyze to dig deeper for customer truth, act on reliable insights and data, and acknowledge customers’ impact.
- Alida TXM helps businesses make better decisions faster by providing deeper insights into their customers, and this helps businesses stand out in their industry, launch new offerings, reach new markets, and even pivot with ease and confidence.
Pricing
Alida provides flexible pricing models, in order to meet everyone’s needs. Pricing is available via inquiry.
Bottom line
Alida is best suited for businesses that face increasingly complex issues, such as inflation, supply chain obstacles, and waning brand trust. No matter what sector a company is in, Alida TXM can help access hard-to-reach audiences to provide a deeper understanding of customers and make better business decisions. The platform is suitable for the media, technology, BFSI, retail, and healthcare industries.
For a CX platform to be effective, everyone from marketing to HR to product development should have immediate and easy access to the critical customer feedback that informs make-or-break decisions, and Alida TXM provides this always-on access to real-time answers. With Alida, businesses get 10X insights, 10X faster for 10X ROI.
Heap: Best for Digital Insights
Overview
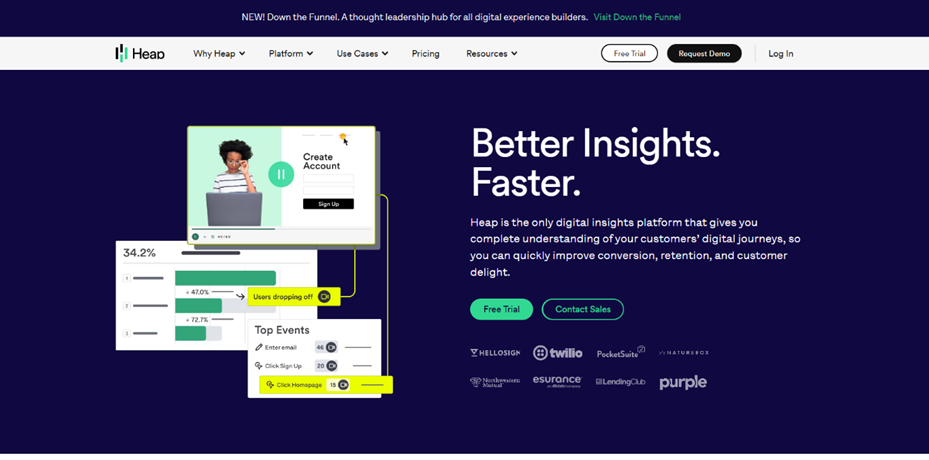
Heap Analytics is a data analytics and digital insights platform that provides users with a complete understanding of their customer’s digital journeys, allowing for the quick improvement of conversion, retention, and customer satisfaction.
Highlights
- The platform captures the entire digital experience of every user on every platform, which eliminates the need for engineering.
- With over 100 integrations, Heap Analytics provides users with the right information at the right moment in their journey.
- Heap’s advanced data science capabilities alert users to key moments of friction and opportunity in their digital experience, even on user behaviors that they have not been following (just like one of the best user research tools).
- The platform also offers session replay that enables users to get full context on every user action.
Pricing
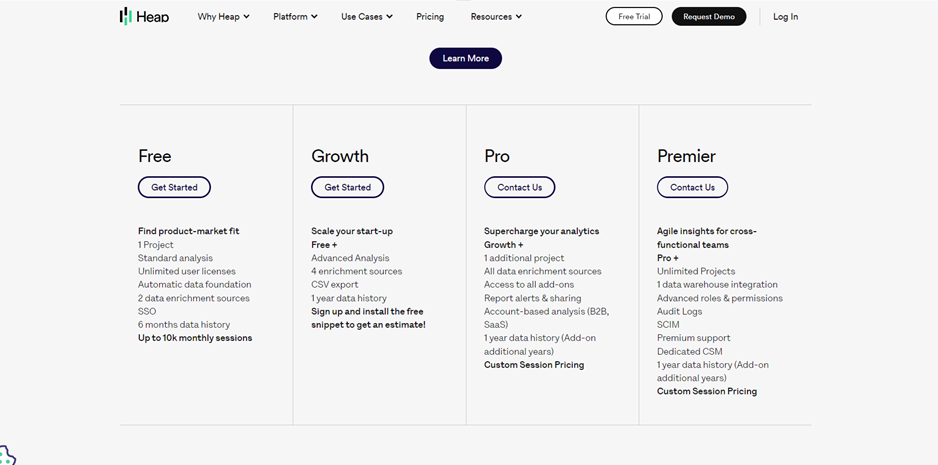
Heap doesn’t disclose pricing, but offers several packages:
- Free Plan
- Growth Plan to scale your startup
- Pro Plan to supercharge your analytics
- Premier Plan to get agile insights for cross-functional teams
Bottom line
Heap Analytics is a data analysis tool intended for digital experience builders who want to create great digital experiences. The platform’s unique features and capabilities enable users to create data-driven decisions that lead to better business outcomes.
Diagnostic Data Analytics:
FullStory: Best Digital Experience Intelligence
Overview
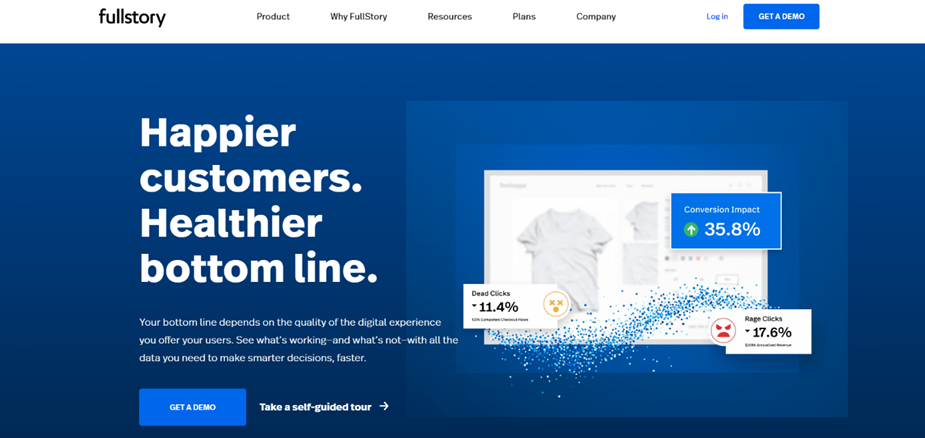
FullStory is a digital experience intelligence software that offers insights to help businesses provide quality digital experiences to their customers. With FullStory, businesses can monitor their entire digital experience and identify where users are struggling with their website, mobile app, or software platform using proprietary auto-capture technology.
FullStory is the most trusted name in Digital Experience Intelligence, and it is used by over 11,000 of the most popular digital destinations, such as L’Occitane, SytnerGroup, William Hill, and Elvie. The software offers a competitive advantage by providing users with a full picture of their user experience data, captured automatically and retroactively, in one place (but if you are looking into a specific software for user testing, check out some of the best user testing tools).
Highlights
- DXI (Digital Experience Intelligence) is FullStory’s X-ray vision into the digital experience. With DXI, businesses can track the metrics most crucial to their business goals, watch problems exactly how they played out with session replay and heatmaps, without compromising user privacy, and sync FullStory data with their warehouse to map the entire omnichannel experience and see every path that brings customers to conversions.
- One of FullStory’s top features is its auto-capture technology, which reveals every unknown and allows businesses to find answers to questions they didn’t even think to ask.
- The software enables businesses to quickly identify root causes or opportunities for improvement, and prioritize changes by quantifying impact. FullStory’s proprietary auto-capture technology allows businesses to optimize their users’ experience by seeing how they navigate, even across multiple tabs. This feature has helped businesses such as Lowe’s to save millions of dollars and use the time and resources elsewhere (for what they probably used one of the best AI time management tools).
- The software gives users feedback on what they love or why they leave, allowing businesses to prioritize the work that most impact their bottom line.
- FullStory also provides qualitative insights through its session replay and heatmap features.
- FullStory’s dashboard displays important metrics such as decreased rage clicks, increased conversions, and decreased JavaScript errors, making it easy to track and optimize the user experience.
- The software offers an open API and a growing catalog of integrations, making it easy to leverage the full power of users’ data using the full range of their data tools.
Pricing
FullStory offers three pricing tiers but doesn’t disclose the pricing. You can request a demo before committing to a plan.
- Business Plan
- Advanced Plan
- Enterprise Plan
Bottom line
FullStory is best used by businesses looking to provide quality digital experiences to their customers. The software is intended for product managers, engineers, designers, and marketers who want to improve their users’ experience, build better experiences efficiently and effectively, and optimize their website, mobile app, or software platform. FullStory provides privacy protections for faster optimization, private-by-default settings, industry-leading security practices, and automatic PII detection, providing brands with the peace of mind they need to build faster.
LogRocket: Best Mobile Device Tool
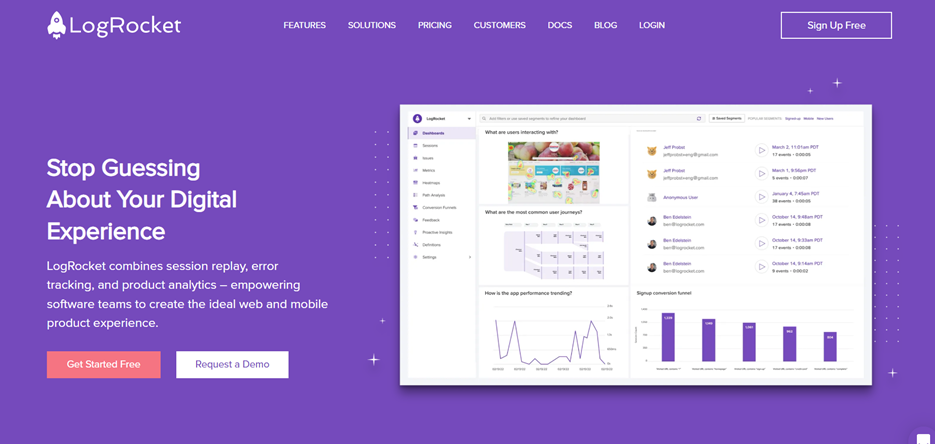
Overview
LogRocket is a software that combines session replay, error tracking, and product analytics. It is designed to provide insights into the user experience of web and mobile apps. It empowers software teams to create the ideal digital product experience by collecting user experience data and surfacing issues with engineering, product, and marketing teams.
Highlights
- LogRocket’s top features include session replay, user experience analytics, machine learning, frontend performance monitoring, error tracking and issue management, and product analytics.
- LogRocket provides pixel-perfect video replay to solve user-reported issues, understand every bug and user-reported issue, and see network logs, Javascript errors, and performance telemetry for in-depth debugging.
- LogRocket also allows for live co-browsing to guide users to a resolution.
- LogRocket stands out by allowing users to identify and prioritize the most impactful technical and user experience (UX) issues, using machine learning to cut through the noise and find the highest-impact issues, and getting alerted to issues before users can report them.
- It also helps users measure success with self-serve product analytics, answer any analytics question without code changes, and watch replays of user behavior to understand the “why” behind metrics and KPIs.
- LogRocket works with various technologies, including React, Redux, Vue.js, React Native, Android, and IOS. It is used by over 100k engineers, PMs, marketers, support agents, and designers to create amazing web and mobile experiences.
- LogRocket also helps in measuring success with self-serve product analytics and providing insights into the user experience of web and mobile apps. LogRocket can be self-hosted or used as a hosted solution.
Pricing
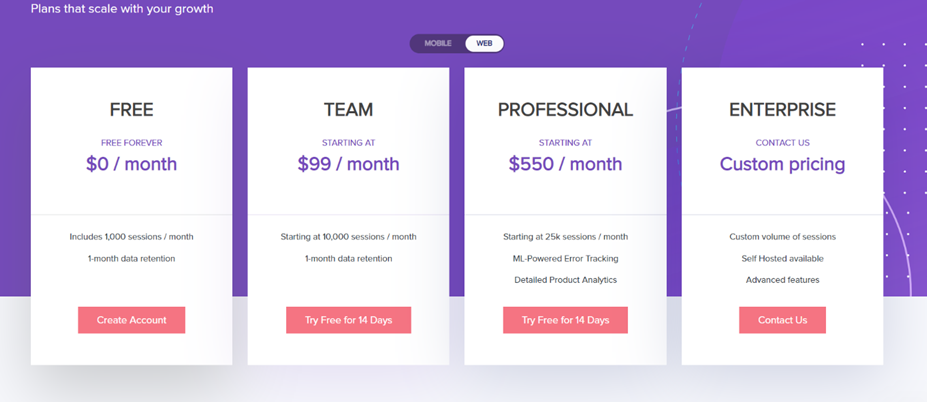
Pricing differs on the web and mobile devices, but here we will cover the web. For mobile pricing, click here.
- Free Plan
- Team Plan for $99 per month
- Professional Plan for $550 per month
- Enterprise Plan has custom pricing, available upon contacting
Bottom line
The software is intended for software teams to deliver the best web and mobile experiences by providing comprehensive views of user experiences across web and mobile apps. It is best used for solving user-reported issues, understanding every bug and user-reported issue, identifying and prioritizing the most impactful technical and UX issues, and optimizing conversion and adoption.
Usabilla: Best for Real-Time Data
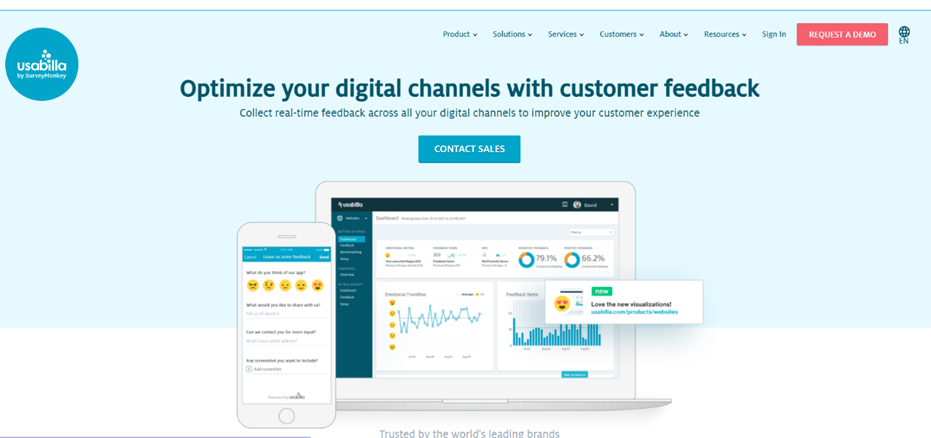
Overview
Usabilla is a customer feedback tool that enables businesses to improve their customer experience by collecting real-time feedback across all digital channels. With over 10 years of experience in the digital customer experience industry, Usabilla has been trusted by leading brands to provide insights and understand the “why” behind their data. Usabilla offers three different solutions: Usabilla for Websites, Usabilla for Apps, and Usabilla for Email, each designed to collect feedback from their respective channels.
Highlights
- One of Usabilla’s top features is the ability to ask users the right questions at the right moment in their customer journey to make better-informed decisions.
- Additionally, Usabilla for Websites enables businesses to eliminate assumptions and get real insights from website visitors, allowing them to proactively improve conversion rates.
- Usabilla for Apps helps improve the mobile app experience by seamlessly integrating feedback into the app and targeting users at a specific moment in their user journey.
- Meanwhile, Usabilla for Email provides data that goes beyond open and click-through rates and helps businesses send the right message to the right audience.
- Usabilla integrates with many solutions already used by businesses, such as Salesforce and Slack, allowing for enriched data and better decision-making.
- With Usabilla, businesses can develop actionable reports, measure impact in a variety of ways, and recruit participants for external focus groups.
Pricing
Custom-priced based on your specific needs. Available upon inquiry. A demo version is also available.
Bottom line
In summary, Usabilla is a versatile customer feedback tool trusted by leading brands that allows businesses to collect real-time feedback across all digital channels, eliminating assumptions and enabling informed decision-making. It stands out with its ability to ask the right questions at the right time, and its integrations with many widely used solutions.
Usabilla is intended for businesses that want to enhance their research data with actionable customer insights and analyze customer behavior to drive customer-centric improvements across their organization.
Predictive Data Analytics:
Alteryx: Best for Newbies and Data Scientists Alike

Overview
Alteryx is an end-to-end analytics automation platform that accelerates the digital transformation process by automating analytics, data science, and machine learning processes. The platform unifies data science, automation, and analytics within a single interface.
Highlights
- Alteryx’s drag-and-drop analytics solution, Alteryx Designer, is a leading feature that allows users to profile, prepare and analyze data.
- This software is unique in that it enables everyone to generate transformational outcomes from data, regardless of skill level. It covers everything from insight to action across every data type and source, providing insights across hundreds of use cases, on-prem, and in the cloud. With Alteryx, executing every task takes only minutes or hours, not days and weeks.
- The platform’s top features include Alteryx Auto Insights, a data storytelling and collaboration tool that automates insights and feature engineering, and Alteryx Machine Learning, which provides automated insights and feature engineering.
- Alteryx Designer FIPS, a FIPS 140 capable version of Designer, and Alteryx Server FIPS, a FIPS 140 capable version of Server, are security features that ensure governance and trust.
- Additionally, Alteryx Intelligence Suite is a text mining and predictive modeling feature that provides users with advanced analytical capabilities.
- Alteryx’s self-service, unified, and enterprise-grade platform provides all employees with the power to turn data into insights.
Pricing
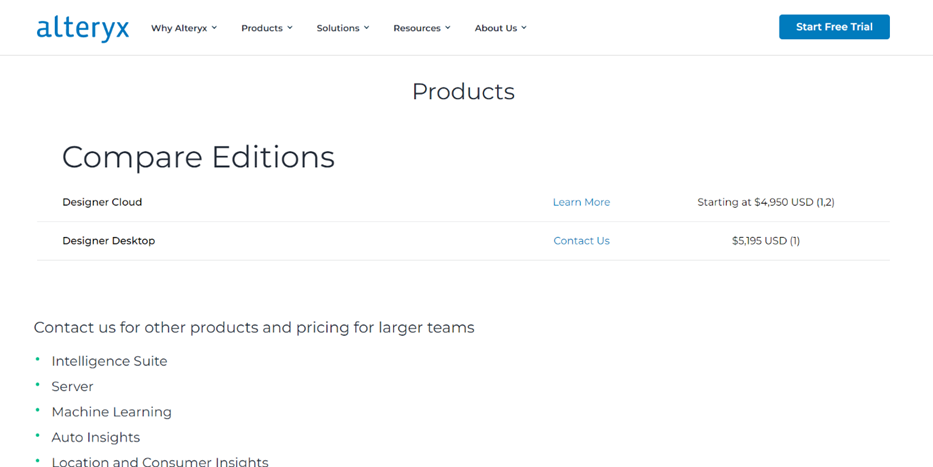
- Free trial version
- Designer Cloud Plan for $4,950
- Designer Desktop Plan for $5,195
For more pricing info, visit the Alteryx pricing page.
Bottom line
The software is intended for organizations of all sizes and industries, from beginners to advanced users, and is best used for automating analytics and data science processes, enabling anyone to generate transformational outcomes from data. Its customers include some of the world’s most influential brands such as Coca-Cola, Siemens Energy, and McLaren, which chose Alteryx to help empower their employees to make transformational outcomes.
Looker: Best Collaboration Platform
Overview
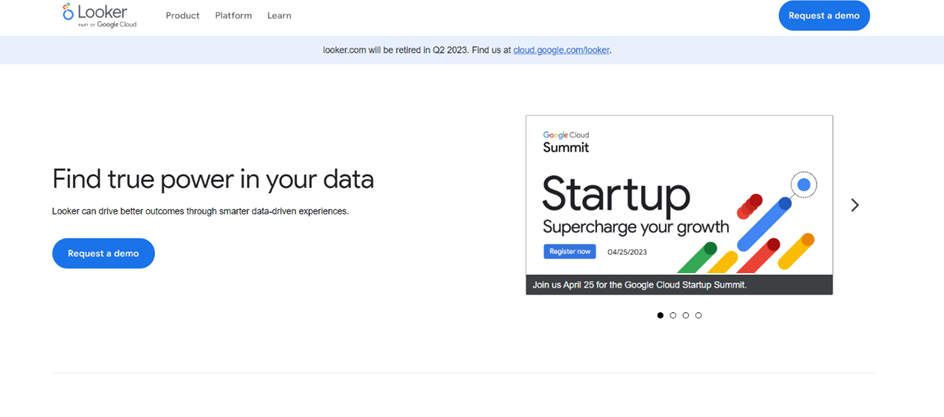
Looker is a data analytics software that provides businesses with data-driven insights for smarter decision-making. It’s a collaborative platform that enables teams to make data-informed decisions and offers features that stand out from other similar data mining tools around.
Looker offers a range of solutions, including embedded analytics, data modeling, data visualizations, and more. Looker’s most notable feature is its ability to support multiple data sources and deployment methods, providing options without compromising transparency, security, or privacy.
Highlights
- Looker offers various features, including secure, governed single-source-of-truth, one platform, and quick time-to-value.
- Looker Blocks, embedded visualizations, and more can help teams with analytics and insights that drive results.
- Looker’s intelligent business software can combine all data for a more expansive view of company metrics, give a 360° view of customer interactions with unified data across touch-points, and provide efficient visualizations to drill down from each dashboard for clarity into what’s happening at the moment.
- Looker’s platform is designed to give users the power to discover the answers they need to sophisticated questions, allowing teams to have a deep impact and support business growth.
- Looker is recognized in the Gartner 2021 Magic Quadrant for Analytics and Business Intelligence Platforms.
Pricing
Looker doesn’t disclose their pricing on their website, but you can request a demo or a quote.
Bottom line
Looker’s data analysis software is intended for companies of all sizes and industries, including retail, healthcare, and finance. Looker can serve up real-time dashboards for in-depth, consistent analysis, enhance the tools you’re already using by infusing new, relevant data, and give teams unified access to the answers they need to drive successful outcomes.
Looker’s intelligent business software allows users to maintain control of their data and to connect directly to live row-level data. The data analytics tool helps define the metrics that drive businesses while providing single-point access to trustworthy data.
Qlik Sense: Best AI-powered Tool
Overview
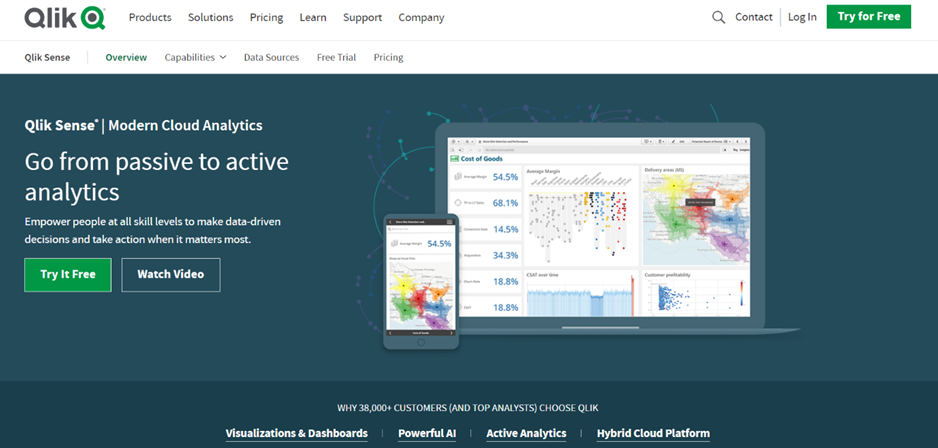
Qlik Sense is a cloud-based analytics software that allows users to explore, visualize and analyze data from multiple sources in one place. The software helps businesses to make data-driven decisions and take action when it matters the most. With Qlik Sense, even users without technical knowledge can easily create and customize visualizations and dashboards, thanks to its powerful AI technology that suggests insight and automates analytics creation and data preparation processes.
Highlights
- Qlik Sense’s one-of-a-kind Associative technology is a standout feature that sets it apart from competitors. It brings unmatched power to the core of Qlik Sense’s industry-leading analytics experience, allowing users to explore data freely at the speed of thought, with hyperfast calculations, always in context, and at scale.
- Unlike query-based analytics and dashboards that are limited by predetermined queries and prebuilt visualizations, Qlik Sense’s Associative technology provides deeper interactivity, broader context, and lightning-fast results.
- Qlik Sense’s Active Intelligence is another key feature that sets it apart from competitors. It combines a real-time data pipeline with action-oriented analytics capabilities, creating Active Intelligence that provides in-the-moment insights and drives immediate action. This enables organizations to have a dynamic relationship with information that reflects the current moment, empowering them to seize every business moment with intelligent alerting, powerful collaboration, mobile and embedded analytics, and automated triggering of actions.
- The software supports any combination of public cloud, private cloud, and on-premises sites, giving users unmatched performance and flexibility.
Pricing
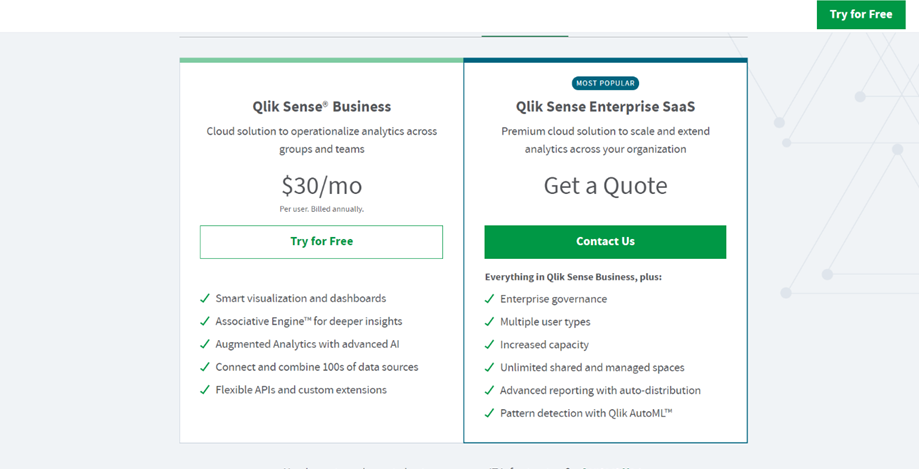
- QlikSense Business Plan starts at $30 per month
- QlikSense Enterprise SaaS pricing is available upon require
Bottom line
Qlik Sense is designed for organizations of all sizes and industries, and it is best used for empowering people at all skill levels to make data-driven decisions and take action when it matters most. With Qlik Sense, users can connect and combine data from hundreds of diverse data sources, from apps and databases to cloud services, files, and more. Its augmented analytics capabilities help users understand and use data more effectively, minimizing cognitive bias, amplifying discovery, and elevating data literacy.
Tableau: Best Business Insights Tool
Overview
Tableau is a visual analytics platform that helps people see and understand data, transforming the way data is used to solve problems. It enables organizations of all sizes to be more data-driven, and its products are designed to put the user first, whether they are an analyst, data scientist, student, teacher, executive, or business user.
Tableau’s mission is to help people see and understand data, and its analytics platform makes it easier for people to explore and manage data, and faster to discover and share insights. It is a market-leading choice for modern business intelligence and is trusted by organizations around the world.
Highlights
- The Tableau community has more than a million members and is the power to connect with like-minded people, learn, grow, and be inspired.
- Tableau’s integrated platform makes it easier for people to work with their data, from data preparation to analysis to sharing insights. Its ease of use enables users to easily see and understand their data with drag-and-drop actions, interactive dashboards, and advanced analytics.
- Tableau’s trusted leader status stems from its focus on security and flexibility, making it a powerful and secure end-to-end analytics platform.
- As part of Salesforce, Tableau offers CRM Analytics, enabling users to see AI-driven analytics and predictions in a single platform. With CRM Analytics, users can work smarter, spot trends faster, and predict outcomes natively in the world’s #1 CRM.
- Tableau’s Data Cloud for Tableau unlocks customer data and delivers actionable insights at scale, enabling everyone in an organization to visualize, automate, explore, and act on data.
Pricing
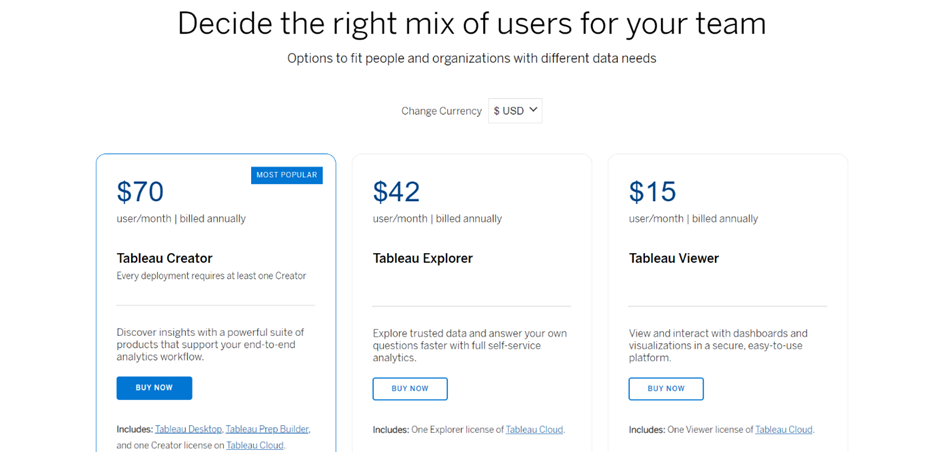
- Tableau Creator Plan for $70 per user per month
- Tableau Explorer Plan for $42 per user per month
- Tableaus Viewer Plan for $15 per user per month
Bottom line
Tableau is intended for data analysts, data scientists, students, teachers, executives, and business users who want to be more data-driven. Tableau is best used for exploring and managing data, discovering and sharing insights, and accelerating data-driven decisions.
Amplitude: Best In-Depth Product Analysis
Overview
Amplitude is a digital analytics platform trusted by leading brands such as PayPal, Dropbox, and Walmart. Amplitude allows users to build powerful audience segments backed by first-party data that can be used to personalize their products.
Highlights
- Amplitude offers a solution to the product-data problem by providing in-depth product analytics, seamless identity resolution, and targeting for A/B testing. Additionally, Amplitude offers a Customer Data Platform that enables the building of audience lists and streamlining of customer profiles.
- It provides data without drama by connecting the entire data ecosystem across applications, servers, tools, and warehouses.
- The analytics platform offers 4 core features that stand out: Funnel Analysis, Event Segmentation, Data Tables, and Retention Analysis.
- With Funnel Analysis, users can visualize common paths users take in the product to find friction points and build a seamless experience that converts more users.
- The Event Segmentation feature helps users identify what drives long-term value and isolate the drivers of purchasing, engagement, and retention.
- Data Tables help compare any mix of user behaviors, attributes, or metrics to pinpoint the best acquisition channels, costs, and more.
- Retention Analysis allows users to visualize the stickiest features and create user groups to understand which users return most often, and why.
Pricing
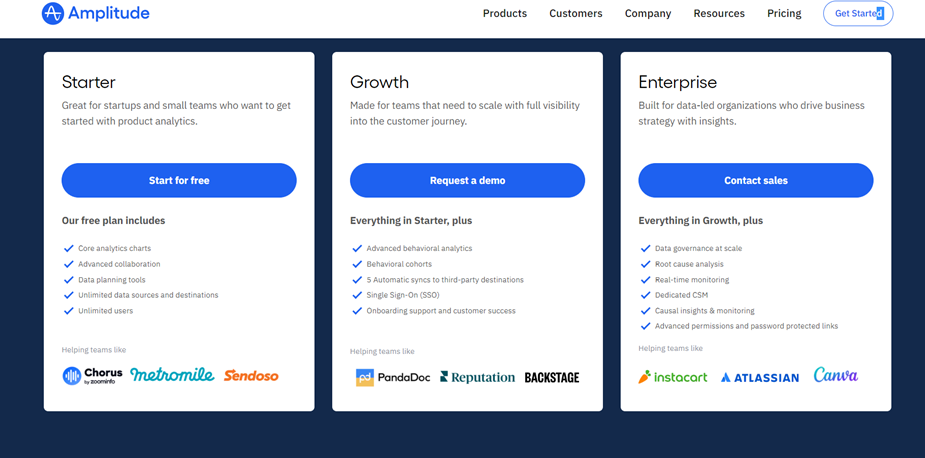
- Starter Plan is free
Amplitude offers paid plans as well. Pricing is available upon request.
- Growth Plan
- Enterprise Plan
Bottom line
Amplitude is intended for anyone seeking to unlock the power of their products by getting data they can trust and insights to drive growth. It is best used by product managers, developers, and growth marketers.
Perspective Data Analytics:
Appcues: Best for Personalization
Overview
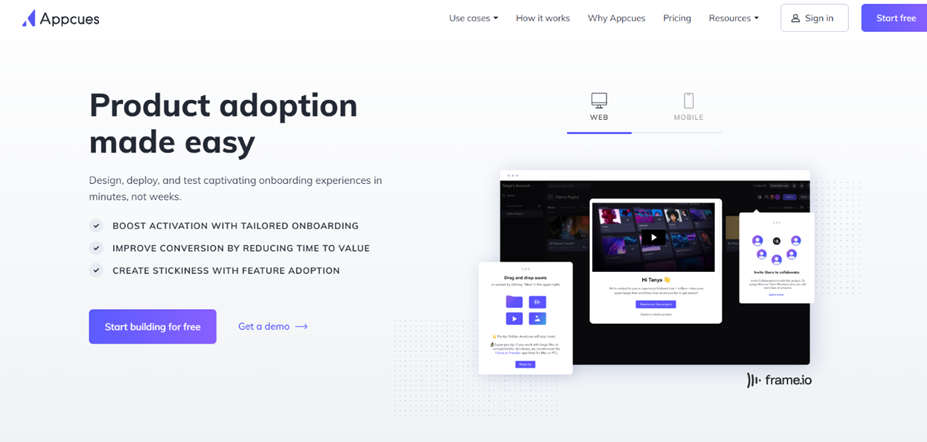
Appcues is software that makes product adoption easy. It helps you design, deploy and test customized onboarding experiences in minutes rather than weeks. Appcues is aimed at scaling product-led organizations that are leading with experience. It is beneficial for those who want to guide users to unlock the value of their product faster. Doing so improves user activation, personalizes onboarding, and improves paid conversions.
Highlights
- Appcues allows you to quickly build and iterate on in-app experiences without setup friction, engineering support, or hassle. It is structured for success, making it a trusted, reliable partner with the expertise, resources, and track record to help you confidently reach your goals. The software is highly rated by G2Crowd and Capterra, achieving a 4.7/5 and 4.8/5 rating respectively.
- Appcues’ top features that stand out from other similar tools are personalization, scalability, and the ability to target experiences to the right users at the right time. Its detailed reporting feature helps to measure the impact on key segments, like trailers or new users.
- Appcues uses personalized welcome flows and targeted checklists to guide new users to their “aha” moment and shorten the time it takes them to see the value.
- It also allows you to use slideouts, tooltips, and hotspots to drive awareness and adoption of new features or nudge users to discover features they have yet to try.
- With Appcues, the organization can hyper-target messages and announcements.
Pricing
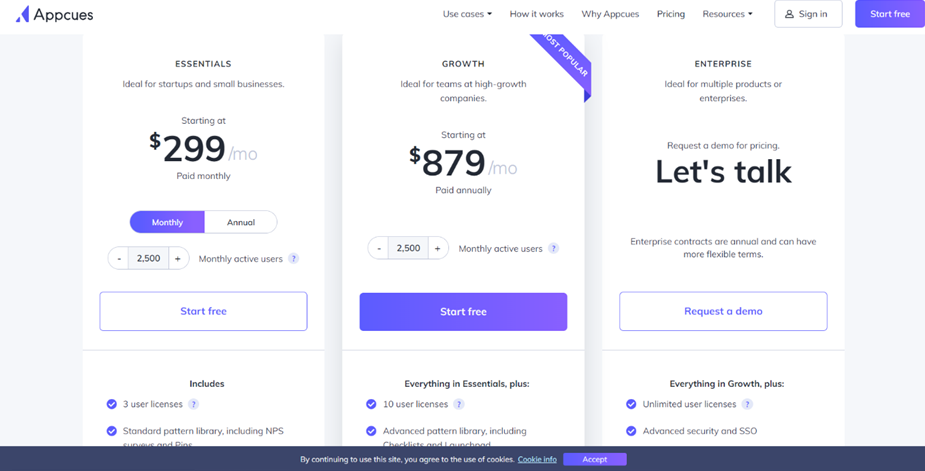
- Essentials Plan for $299 per month
- Growth Plan for $879 per month
- Enterprise Plan is custom-tailored
Bottom line
In conclusion, Appcues is a personalized, scalable, and trusted tool that can help guide users to unlock the value of a product faster. It is an excellent option for scaling product-led organizations that want to improve user activation, personalization of onboarding, and paid conversions. Its standout features make it a top choice for those who want to improve feature adoption, usage, and retention.
WalkMe: Best No-Code Platform
Overview
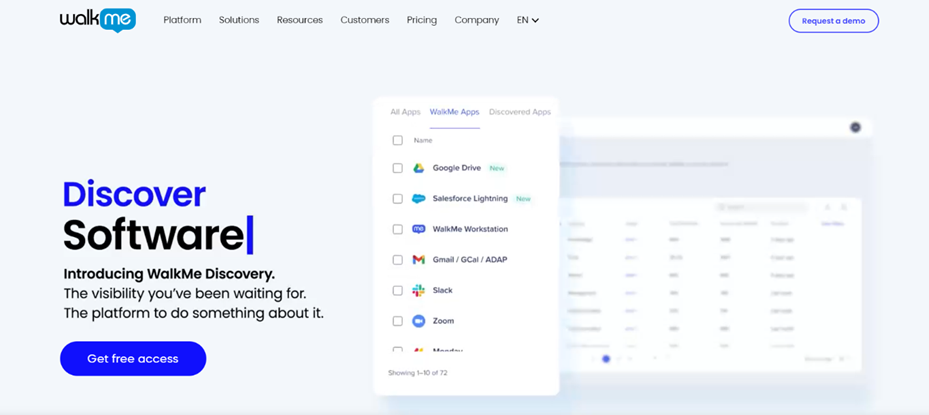
WalkMe is a no-code digital adoption platform that helps organizations leverage data to simplify user experiences across their enterprise applications. It connects users to workflows and allows businesses to take immediate, data-driven action to fix what isn’t working across workflows and applications.
Highlights
- WalkMe creates personalized, simplified, and automated experiences that allow employees to get the job done, thus improving data integrity and employee productivity. The tool helps businesses take a user-first approach to software adoption, measuring and optimizing user experiences to drive business workflows and simplify change management.
- WalkMe’s key features include automated workflows, personalized guidance, in-app training, and customized insights.
- The tool is highly adaptable, readily configured to match specific business requirements, and does not require any additional code.
- WalkMe’s ability to automate workflows and eliminate traditional face-to-face training sets it apart from competitors.
- Businesses that have used WalkMe have seen up to a 50% reduction in customer support requests, a 50% reduction in time to proficiency, and a 40% reduction in training costs.
Pricing
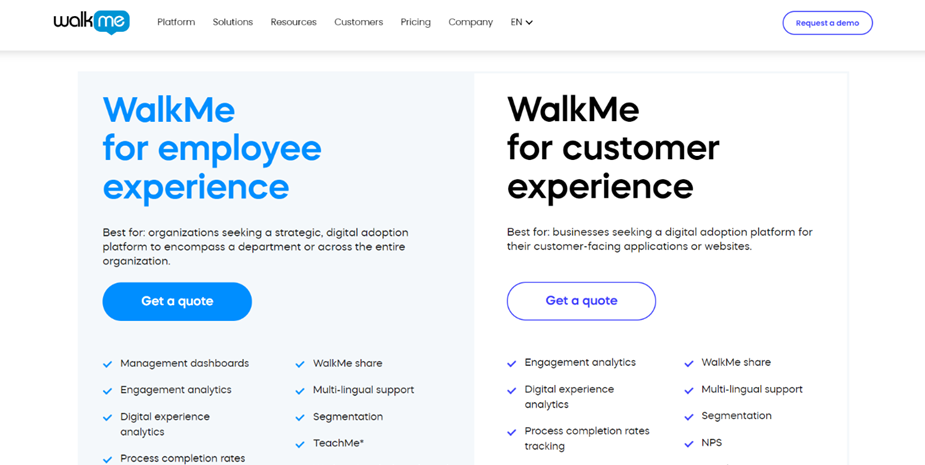
WalkMe offers 2 pricing options but doesn’t disclose the numbers on either. The pricing is available via contact.
- WalkMe for employee experience
- WalkMe for customer experience
Bottom line
The platform enables organizations to uncover what software they have, prioritize and manage their digital adoption initiatives, and see where users are struggling. The tool is intended for businesses across industries, including financial services, energy, and utilities, healthcare, manufacturing, the public sector, technology, and retail. WalkMe’s customers include 31% of the Fortune 500 companies, with over 2,000 customers and 35M users in 42+ countries.
Cognitive Data Analytics:
Microsoft Power BI: Best Data Visualization Tool
Overview
Microsoft Power BI is a business intelligence platform that helps users turn their data into insights and take data-driven actions with data analysis and data visualization. Power BI provides an end-to-end solution to create a single source of truth, uncover insights and translate them into impact.
Power BI is a self-service analytics platform that can scale from individuals to the organization as a whole, and provides a wide range of smart tools for strong results.
Highlights
- With its hundreds of data visualizations, built-in AI capabilities, tight Excel integration, and pre-built and custom data connectors, Power BI can help users find and share meaningful insights. It also helps users to reduce the added cost, complexity, and security risks of multiple solutions.
- Some of the top features of Power BI include the ability to create rich, interactive reports with visual analytics that can be accessed through a mobile app while on-the-go, and the ability to connect Power Automate across Microsoft Power Platform, Microsoft 365, Dynamics 365, Azure, and hundreds of other apps.
- Power BI also provides industry-leading data security capabilities including sensitivity labeling, end-to-end encryption, and real-time access monitoring.
- Power BI is known for delivering better decision-making to organizations, and it has been implemented by leading businesses such as Swiggy, India’s leading food ordering and delivery platform, for tracking near real-time metrics across their rapidly growing business, enabling data-driven decision-making.
- Power BI was named a Leader in the April 2023 Gartner® Magic Quadrant™ for Analytics and Business Intelligence Platforms, positioned highest for Ability to Execute and furthest for Completeness of Vision.
Pricing
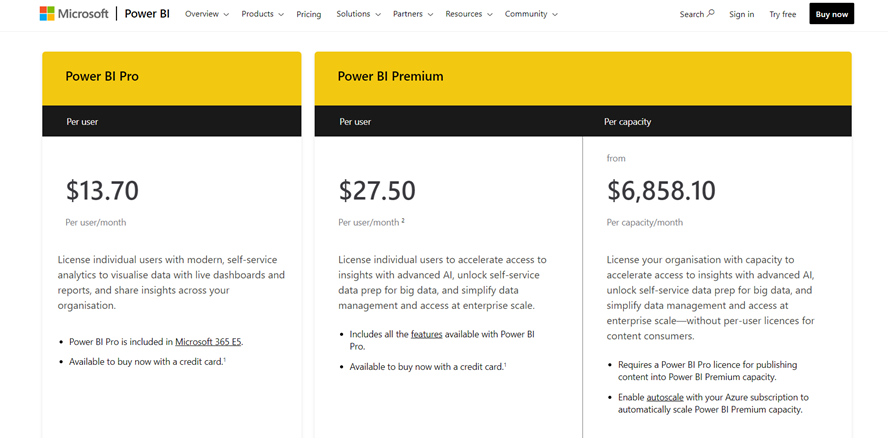
- Power BI Pro Plan is priced at $13.70 per user per month
- Power BI Premium Plan is $27.50 per user per month
- Power BI Premium Plan is $6,858.10 per capacity per month
Bottom line
Overall, Power BI is a powerful tool that can be used by businesses of all sizes to create a data-driven culture and make confident decisions using up-to-the-minute analytics. Its smart tools, end-to-end solution, and industry-leading data security capabilities set it apart from other similar tools, and its ability to connect to hundreds of popular apps and services makes it a powerful tool for driving innovation across the entire organization.
Klipfolio: Best Tool to Access Diverse Data Sources
Overview
Klipfolio is a data analytics software that enables businesses to make better-informed decisions by providing them with comprehensive insights through a data visualization tool. It provides a range of features that cater to the needs of both builders and data teams, as well as decision-makers.
Highlights
- One of the standout features of Klipfolio is its ability to connect to multiple data sources, including spreadsheets, REST, pre-built metrics, and SQL, among others. This feature enables users to combine data from different sources and metrics in one view and segment, filter, and change visualizations within seconds.
- The software also provides easy data preparation, storage, and history, as well as security, privacy, and access.
- Decision-makers benefit from the software’s explore metrics, data visualizations, dashboards and reports, goals, and notifications. These features enable users to create customizable, presentation-ready data visualizations and dashboards that they can share with colleagues to facilitate better decision-making.
- Klipfolio’s Klips are another standout feature. They enable businesses to create client reports that are customized to meet their clients’ needs.
- The software provides a range of dashboard templates to choose from, making it easy for users to get started with creating their own customized dashboards.
Pricing
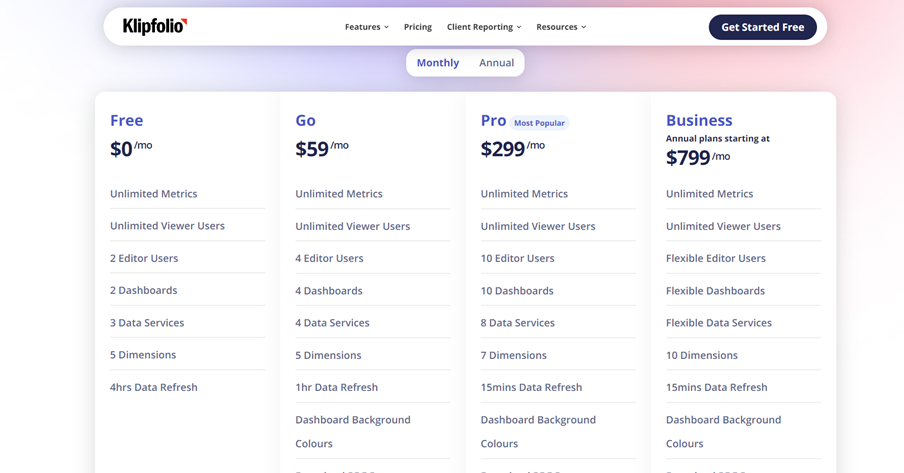
- Free Plan
- Go Plan for $59 per month
- Pro Plan for $299 per month
- Business Plan for $799 per month
Bottom line
The software is best suited for businesses that are looking for comprehensive analytics software that is easy to use and customizable to their specific needs. In conclusion, Klipfolio is a comprehensive data analytics software that provides businesses with a range of features to facilitate better decision-making. The software’s ability to connect to multiple data sources, comprehensive data preparation, and storage features, and customizable dashboards and reports, make it stand out from other similar data analytics tools around. Klipfolio is intended for businesses of all sizes that are looking for easy-to-use and customizable data analytics software.
What is analytics software?
Analytics software is a tool that enables both individuals and businesses to analyze and interpret data in order to make more informed decisions. These kinds of software work by collecting and processing data from various sources, using mathematical and statistical algorithms to analyze patterns and trends amongst the data, and presenting the results in a visual format (data visualization) in order to allow users to gain valuable insights and make informed decisions moving forward.
The software can also have the ability to create predictions based on past data and give recommendations. Data analytics tools can be used to track website traffic, monitor social media, and analyze customer behavior, amongst other uses.
What is the best tool for predictive analytics?
The best tool for predictive analytics depends on the specific needs of your business. Whichever tool you choose should have some if not all of the following key features, that will make it successful at what it should do: data processing, data visualization, machine learning algorithms, model evaluation, integration with other software, scalability, user-friendliness, and security. Some popular options include the ones we mentioned under the Predictive Data Analytics category: Alteryx, Looker, Qlik Sense, and Tableau.
Final thoughts
By understanding the different types of data analytics and what to look for when choosing the best data analytics software and tools, you can gain valuable insights and stay ahead of the competition. Among the tools above, there are tools for newcomers and data scientists alike, and for those with budgets of all sizes, which gives you no excuse to manually analyze data anymore.